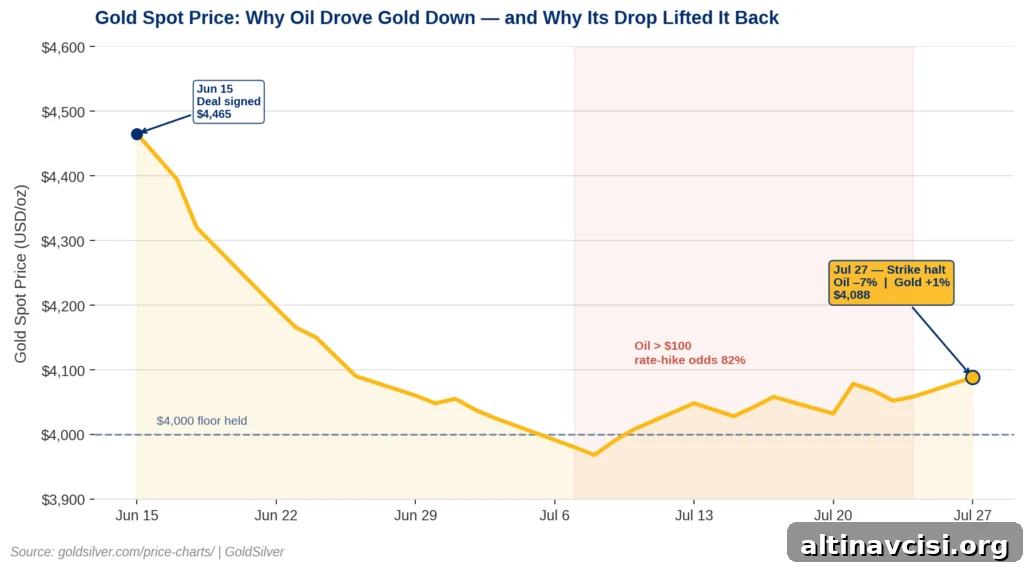
Gold rose by more than 1% on Monday, July 27, 2026, trading around $4,088 per ounce after a sharp fall in crude oil prices. The immediate trigger was a roughly 7% drop in oil after the United States and Iran paused a 13-night sequence of strikes over the weekend. Silver outperformed, climbing over 2% to near $59 per ounce. Both moves are connected: lower oil prices ease inflation expectations, which in turn reduces the odds of near-term rate hikes and makes non-yielding assets like gold more appealing relative to cash and bonds.
Why Did Gold Fall During the Iran War — and Rise When Oil Did?
Many investors view gold primarily as an inflation hedge, so when the US-Iran conflict escalated on February 28, 2026 and oil briefly pushed above $100 per barrel, a gold rally seemed likely. That expectation did not materialize. Instead, gold fell about 12% from its pre-conflict levels, touching nine-month lows, and remained far below its January all-time high near $5,589 per ounce.
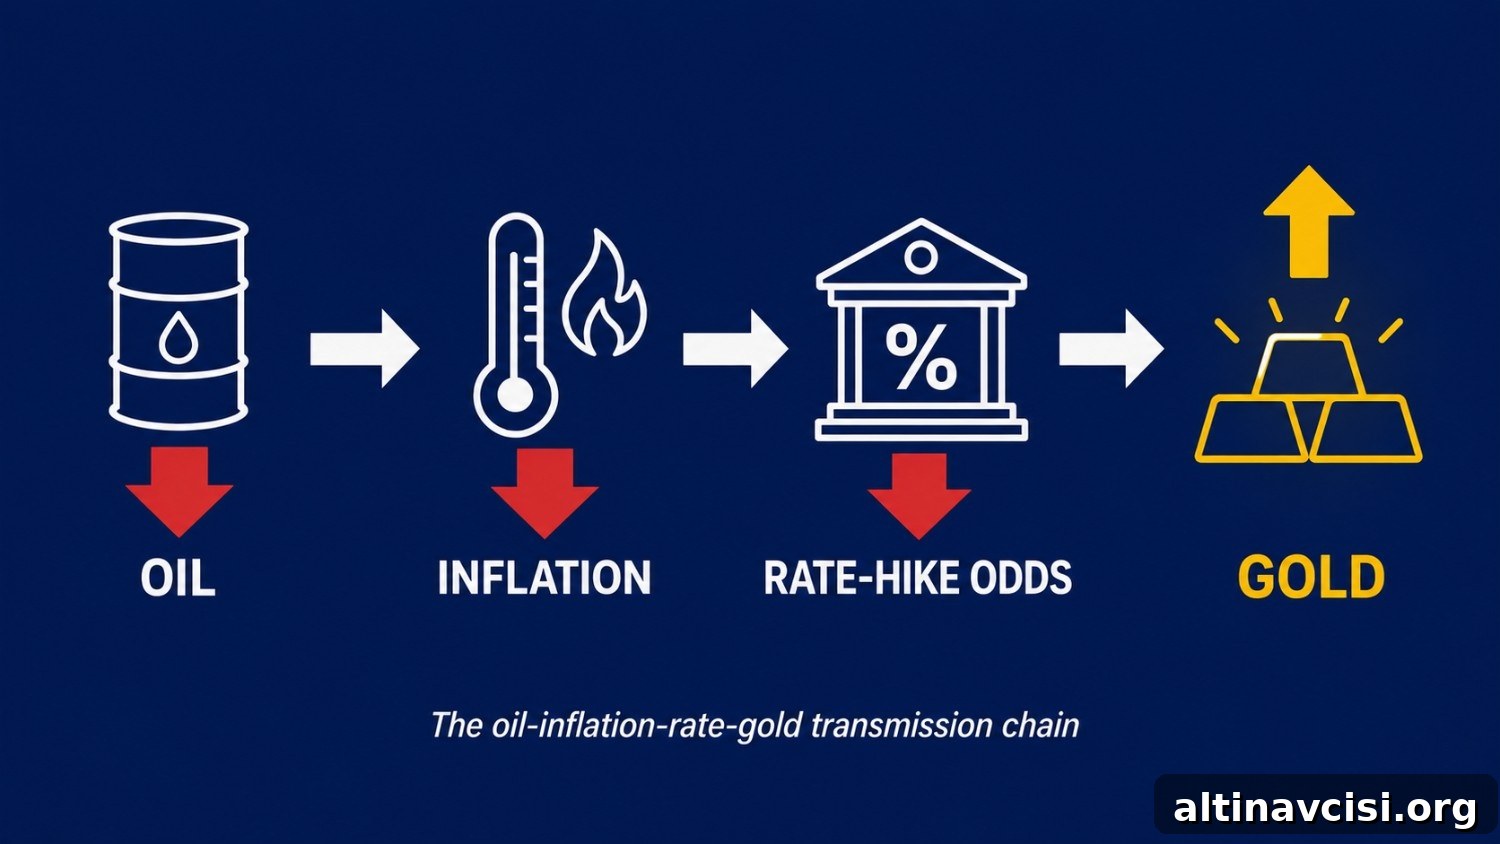
The explanation is a straightforward transmission chain: higher oil pushed headline inflation expectations upward; rising inflation increased the probability that the Federal Reserve would raise rates; higher expected rates raise the opportunity cost of holding non-yielding assets such as gold. In short, surging oil lifted inflation fears and prompted markets to price in additional tightening, which made gold less attractive. When oil reversed, that chain worked in the opposite direction: lower energy costs eased inflation expectations, reduced near-term rate-hike odds, and improved gold’s relative attractiveness.
The Edge Every Investor Needs
Smarter precious metals investing starts here. The Nuggets Newsletter brings you essential market insights, Fed updates, global trends, educational videos, and much more.
What Is Happening With Gold Prices Today?
The pause in strikes was reported quietly over the weekend. Senior Iranian officials indicated Tehran would maintain the halt while the United States reciprocated, and US officials confirmed a temporary pause intended to create diplomatic space. Markets reacted immediately: Brent crude fell about 7–8% on Monday to under $90 per barrel, its lowest since July 20. As the implied inflation threat eased, markets reduced the odds of a September rate hike and buyers returned to precious metals.
Silver’s stronger performance narrowed the gold-silver ratio from about 69.7 to roughly 68.9 because silver benefits from both monetary demand and industrial demand. When rate-hike fears ease, both drivers can recover, giving silver an additional tailwind relative to gold.
That said, the move higher in metals comes with important caveats. The Strait of Hormuz remains under restricted navigation, Houthi attacks targeted Red Sea facilities over the weekend, and no formal, durable agreement has been announced between Washington and Tehran. The current pause is precisely that: a temporary lull in hostilities rather than a comprehensive resolution.
What Does the Iran Pause Mean for the Fed’s July 29 Decision?
The Federal Reserve begins a two-day meeting on Tuesday, July 28, with the policy decision scheduled for Wednesday, July 29 at 2:00 PM ET and the post-decision press conference following at 2:30 PM ET. Markets had been split between a hold and a hike as recent oil-driven inflation concerns pushed the odds for a September lift higher. The sudden drop in energy prices lowers headline inflation pressure, which may temper hawkish sentiment within the committee.
Because some committee members have signaled caution, the tone of the Fed chair’s press conference will be particularly important for markets. A dovish or cautious tone that signals less urgency about additional tightening would reduce September hike odds further. Conversely, a strongly hawkish tone would keep tightening expectations intact despite recent oil moves. Investors should also monitor the June PCE inflation report due the following day; cooler energy readings would reinforce the argument that tightening pressures have eased.
The Story Most Investors Are Missing
One of the most notable technical facts: gold held above $4,000 through thirteen consecutive nights of military strikes and significant oil volatility. That resilience matters. In a prior ceasefire, gold jumped quickly, but the more revealing observation is that gold did not collapse when tensions were highest and rate-hike odds rose. In other words, the market found a floor even under intense inflation and tightening narratives.
A key structural element undergirding that floor is ongoing central bank demand. Major central banks, including the People’s Bank of China, have continued to add to official gold reserves through June 2026. Central bank accumulation is a structural, long-term source of demand that differs from cyclical forces driven by commodity shocks. The temporary oil-inflation-rate dynamics can push gold lower in the short run, but steady central bank purchases and fiscal policies provide structural support.
For investors tracking gold’s next directional move, two metrics are especially important: the implied probability of a September rate hike as reflected in futures pricing, and the upcoming PCE inflation print for June. Watch the 70% probability threshold on rate markets and Thursday’s inflation data closely; those two inputs are likely to set the tone for gold and silver over the coming weeks.
Stay On Top of Gold & Silver Prices
Get important market alerts sent straight to your inbox.
SOURCES
1. GoldSilver — Live Gold and Silver Spot Prices, July 27, 2026
2. Reuters via Business Recorder — Iran will halt attacks as long as US does the same, July 27, 2026
3. Fox News — US strikes on Iran paused; Ambassador Waltz confirms space for diplomacy, July 27, 2026
4. NBC News — Oil prices slide as US and Iran pause strikes, July 27, 2026
5. Saxo Bank — Market Quick Take: Oil gaps lower as US-Iran strikes pause, July 27, 2026
6. CME Group — FedWatch Tool, July 2026 FOMC Rate Probabilities
7. Federal Reserve — FOMC Statement and Minutes, June 16–17, 2026
8. CNBC — Fed rate decision: Odds surge for hike as oil rips higher, July 23, 2026
9. FXStreet — Silver Price Today: Gold/Silver Ratio 68.93, July 27, 2026
10. House of Commons Library — US-Iran Ceasefire and Nuclear Talks in 2026
11. Silver Institute — World Silver Survey 2026 (Metals Focus)
12. Bureau of Economic Analysis — PCE Price Index, July 30, 2026 release
Disclaimer: This article is for informational purposes only and does not constitute financial or investment advice. Always consult a qualified financial adviser before making investment decisions.
You May Also Like:
- Oil Spiked 7% Yesterday. Silver Sold Off. Today Physical Buyers Are Doing Something Different.
- Newmont Earned $2.2 Billion Last Quarter. Gold Was Down 13%.
- The US Has Over $1 Trillion in Gold. Washington Carries It on the Books at $11 Billion.
- 187,000 Jobless Claims. The Lowest of 2026. Here Is What It Means for Gold.
- A War Just Expanded Into a New Shipping Lane. Gold Fell. Here Is Exactly Why.
- Gold Is About to Trade 24/7. A Prediction Market Just Filed to Make It Never Expire.