Why Gold Prices Fell After War Spread to New Shipping Lane
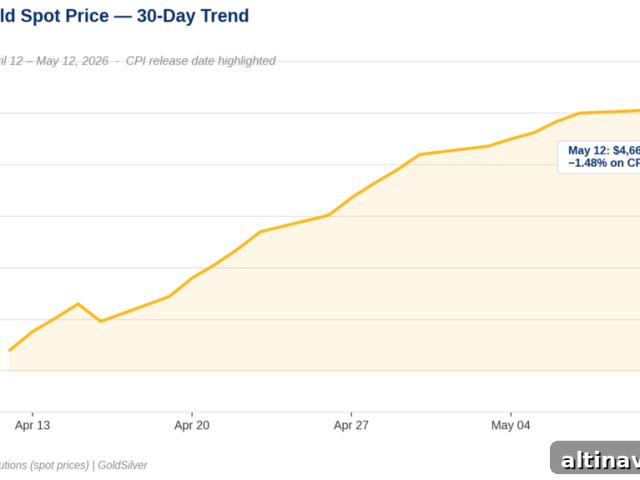
Gold is down about 1.6% today. [GoldSilver price charts, July 23, 2026]
That outcome may seem counterintuitive. Overnight Houthi militants reported attacks on two Saudi oil tankers in the Red Sea. The United States completed its 12th consecutive night of airstrikes on Iran. Secretary of State Marco Rubio said Iran is “not ready to make a deal.” Under older assumptions, those developments would typically lift gold. They did not. The reasons explain how gold behaves in today’s macro environment and what that means for investors who own physical metal.
How Does a Shipping Attack Push Oil Higher?
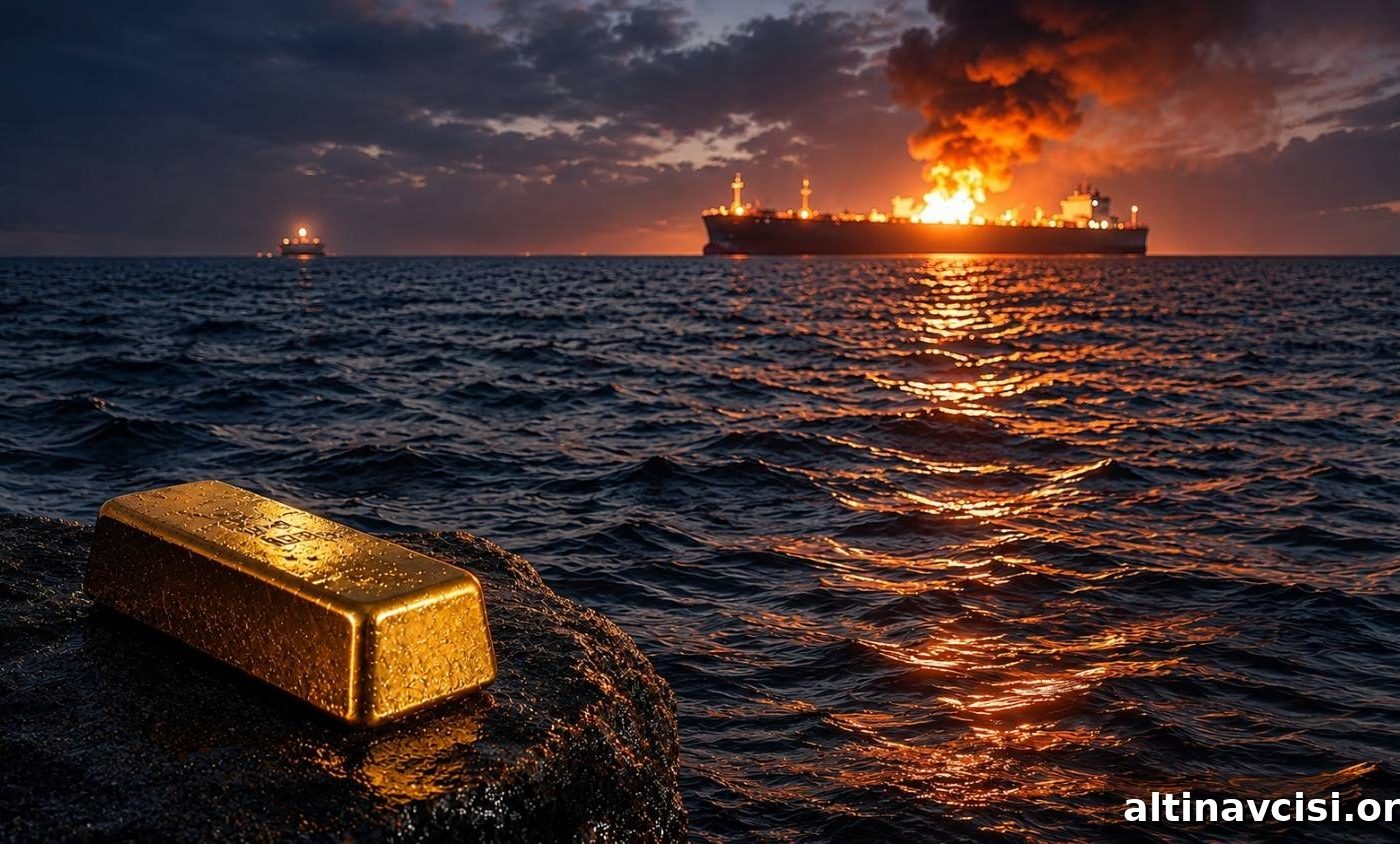
The two tankers reported targeted — the Encelia and the Layla — were Saudi-flagged vessels. The Houthis said they used ballistic missiles, cruise missiles, and drones after accusing the ships of violating a naval blockade the group declared earlier in the week. Saudi state media confirmed the Encelia caught fire and reported all crew members were safe; the Houthis also claimed a strike on the Layla, an account that was unconfirmed at the time of publication. Brent crude jumped as much as 2.5% toward $96 a barrel, reaching a multi-week high.
Geography matters. The Strait of Hormuz connects the Persian Gulf to the Arabian Sea and has seen the bulk of recent shipping disruptions. The Bab el-Mandeb Strait — where these most recent attacks occurred — sits at the southern tip of the Arabian Peninsula and links the Red Sea to the Gulf of Aden. In normal times, roughly 10% of global seaborne oil trade moves through Bab el-Mandeb. Saudi Arabia had already rerouted some exports through the Red Sea after Hormuz disruptions shut down normal Gulf shipping; now that alternate route is under threat. Several vessels have diverted to avoid the area. When shipping costs and the price of oil rise together, headline inflation tends to remain elevated — precisely the problem the Federal Reserve is still focused on controlling.

The Edge Every Investor Needs
Smarter precious metals investing starts here. The Nuggets Newsletter brings essential market insights, Fed updates, global trends, and educational content.
Why Does Oil Inflation Hurt the Gold Price Today?
This is the mechanism most headlines miss.
The chain unfolds in four steps. First, Houthi attacks on Saudi tankers push Brent oil toward $96 a barrel. Second, higher oil lifts headline inflation and makes it stickier — US inflation was reported at 3.5% in June 2026, down from a peak of 4.2% in May but still well above the Fed’s 2% goal. Third, stickier inflation makes rate cuts less likely and rate hikes more likely. Fourth, markets reprice the likelihood of Federal Reserve action: as of this morning, the odds of a September rate hike rose above 60% according to market-implied Fed probabilities.
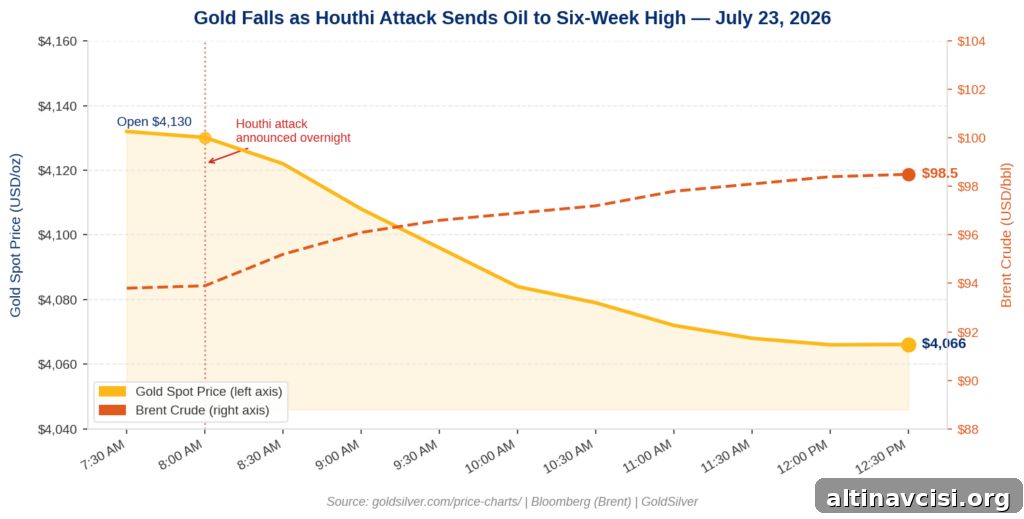
When markets raise their expectation of interest rates, real yields rise — the return investors earn after adjusting for inflation. Gold does not pay a yield, so a higher real yield makes yield-bearing assets relatively more attractive than gold. This effect is not an indictment of gold’s long-term case; it is a near-term reallocation driven by arithmetic and futures-market positioning that can take place within hours.
This same mechanism drove gold’s largest absolute monthly decline on record in March 2026, when oil-driven inflation reversed the Fed’s rate narrative and gold fell more than 10% in a single month. The metal later recovered. The economic mechanism remained the same; the oil price moved.
Earlier today, the European Central Bank held its deposit rate at 2.25% after raising rates in June. Two major central banks are now either tightening or signaling a hawkish hold at the same time, both pointing to energy-driven inflation from the Middle East conflict as a central factor.
What Does This Mean for Physical Gold Holders?
The short-term futures movement misses important longer-term dynamics.
Every disruption that raises shipping risk increases the fiscal cost of the conflict and the price of energy. Sustained oil above $90 per barrel widens the US trade deficit, adds to import-driven inflation, and further pressures an already large federal budget deficit. Those same forces — rising fiscal strain, broader monetary accommodation over time, and currency debasement risks — are the structural drivers that strengthen the long-term case for owning physical gold.
An investor aware of both timelines need not be alarmed by a temporary pullback in futures prices. They can watch the four-step mechanism play out in real time while holding a physical asset that responds to longer, structural trends. Since January’s record high of $5,589.38 per ounce, gold has retraced from that peak but remains roughly 20% higher year-over-year. Central bank purchases, fiscal expansion, and reserve diversification remain intact as longer-term supports; what has shifted is the short-term rate signal, which has flipped before and can flip again when energy prices moderate.
What Should Gold and Silver Investors Watch Next?
Two catalysts will likely determine gold’s direction over the coming weeks.
First: the June Personal Consumption Expenditures (PCE) report on July 30, the Fed’s preferred inflation gauge. It arrives the day after the July 29 FOMC decision. If core PCE prints hotter than expected, the odds of a September hike rise and gold may face further near-term pressure. If core PCE softens, the rate narrative can quickly swing back in gold’s favor.
Second: any credible signs of diplomatic progress in the Iran-related conflict. A reduction in disruptions through Hormuz and Bab el-Mandeb would relieve upward pressure on oil, ease inflationary stress, and unwind the rate-hike arithmetic currently weighing on gold. Political narratives and diplomatic efforts will matter as much as market data in the weeks ahead.
Until those catalysts change the outlook, the position for a physical metal holder is simple: the mechanism that pressures futures prices in the short run is the same one that reinforces the long-term rationale for holding physical gold.
SOURCES
1. Reuters — Houthis say they attacked two Saudi tankers; Saudi Arabia confirms one ablaze, July 22–23, 2026
2. Bloomberg — Oil extends rally after Houthis attack two Saudi tankers in the Red Sea, July 23, 2026
3. CNBC — Houthis claim strikes on Saudi tankers; Rubio says Iran not ready to make a deal, July 23, 2026
4. EastPost / UNCTAD — Strait of Hormuz and Bab el-Mandeb put global trade under pressure, July 14, 2026
5. ECB — Rates held steady at 2.25%, July 23, 2026
6. GoldSilver — Gold Price Charts, July 23, 2026
7. CME Group — FedWatch tool, September 2026 FOMC rate expectations, July 23, 2026
8. US Treasury — Fiscal Data: Debt to the Penny
9. US Bureau of Labor Statistics — Consumer Price Index, June 2026 (released July 14, 2026)
Disclaimer: This article is for informational purposes only and does not constitute financial or investment advice. Always consult a qualified financial adviser before making investment decisions.
You May Also Like:
- Gold Is About to Trade 24/7. A Prediction Market Just Filed to Make It Never Expire.
- Gold Hit a Two-Week High This Morning. Three Forces Arrived at Once.
- The Fed Meets July 29. Gold Says Hold Is Already Priced In. Silver Says Something Else.
- Silver Is Up Nearly 5% This Morning. Here Is Exactly Why.
- China Ends Paper Gold Trading July 24. For Physical Holders, That’s a Confirmation.
- Silver Is Up 1.5% Today. Oil Is Up 3%. Those Two Moves Shouldn’t Coexist. Here’s Why They Do.
Popular Topics
Picked from the archive
-
01
 Topics
Warsh Skips Fed Dot Plot, FOMC Minutes Release Wednesday
-
02
Topics
How Quantitative Easing Affects Gold, Silver and Industrial Metals
-
03
Topics
How to Invest in Silver: A Practical Guide to Growing Wealth
-
04
Topics
Why Gold Prices Drop When Inflation Surges
-
05
Topics
Gold Price Climbs to 7-Week High After One Key Number
-
06
Topics
What to Ask When Choosing a Gold Storage Provider
-
07
Topics
Why Silver Fell 3.8% as Gold Dropped 2.9%
-
08
Topics
Gold Near $4,067 as Jobs Report Fuels Fed Rate-Hike Concerns