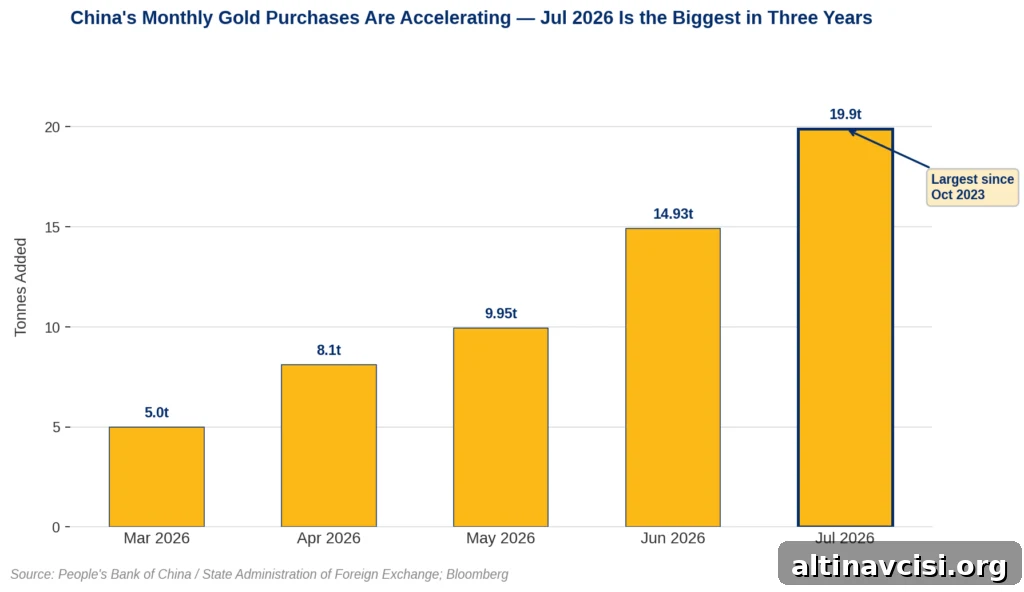
China’s central bank increased its gold holdings by 19.9 tonnes in July 2026 — the largest single-month purchase since October 2023 and the 21st month in a row of additions. The headline number is notable; the rationale and process behind it are more important for investors and reserve watchers.
At the time of reporting, gold was trading near $4,418 per ounce, according to published live price charts.
Why Did China’s Central Bank Buy This Much Gold in July?
Official data show the People’s Bank of China raised its reported gold holdings to 76.08 million troy ounces at the end of July, up from 75.44 million ounces in June. That increase of 640,000 ounces equals roughly 19.9 metric tonnes and marks the biggest single-month addition since October 2023.
The buying rate has picked up steadily through 2026. The PBOC added about 5 tonnes in March, then larger amounts through spring, reaching roughly 14.93 tonnes in June before jumping to 19.9 tonnes in July. On the year, China has added approximately 60 tonnes of official gold so far.
Notably, these purchases continued irrespective of short-term price moves. The buying did not stop when gold briefly fell below $4,000 or when global markets priced in potential Federal Reserve policy changes. That persistence indicates the central bank’s actions are driven by a longer-term strategy rather than by short-term market timing.

The Edge Every Investor Needs
Smarter precious metals investing begins with clear, timely insights. The Nuggets Newsletter focuses on market context, policy developments, global trends, and practical analysis for investors.
What Is Driving the Acceleration?
The driving force behind China’s purchases appears structural rather than tactical. China’s reported gold holdings account for roughly 8 percent of its official foreign-exchange reserves, while the global central bank average is near 27 percent. That gap of about 19 percentage points points to a deliberate, long-term rebalancing rather than a short-term market bet.
Each month’s addition should be seen as one step in a sustained program to shift reserve composition. Reserve managers typically operate on multi-year or multi-decade horizons; they rebalance gradually and persistently to reach target allocations. That mindset explains why the PBOC’s buying streak has continued through varying market conditions and policy signals.
Survey data from central banks support a broader trend: a majority expect the share of US dollars in global reserves to decline over the coming years, and many plan to increase official gold holdings. These strategic intentions at multiple institutions help explain why central banks collectively have been persistent buyers of gold.
What Does China’s Gold Buying Mean for the Price?
Short-term price drivers and long-term reserve dynamics are different lenses. For example, July’s U.S. consumer price index came in at 3.4 percent year-over-year, with core CPI at 2.5 percent, a print that briefly eased market expectations for a near-term Fed rate hike and gave gold a short-lived boost. Gold touched about $4,438 intraday before pulling back to the levels cited above.
But the PBOC’s purchases operate on a much longer timeline. Monthly CPI reports influence markets over hours and days; central-bank reserve rebalancing unfolds over years. Continued official buying acts as a structural demand floor for the metal, while ETF flows and investor interest add cyclical demand on top of that base.
In July, global gold-backed exchange-traded funds recorded inflows that helped push aggregate ETF holdings higher, reversing earlier outflows. Those inflows, combined with sustained official purchases, support liquidity and can influence price direction over medium-term horizons.
How Does This Streak Compare to History?
The current 21-month accumulation streak started in November 2024 and is the longest continuous documented run since China began publishing consistent monthly reserve disclosures in 2015. Across the full streak, official additions exceed 100 tonnes, with roughly 60 tonnes added in 2026 alone. At prevailing spot prices, those holdings represent significant value on the central bank’s balance sheet.
China is part of a wider pattern: many central banks expect to raise their gold allocations over the next year, and a large share of respondents to surveys plan to add gold to official reserves. That collective behavior reinforces the structural demand narrative for gold.
What Does This Mean for Individual Savers?
Institutional reserve management and personal saving share the same basic mechanic: adjusting allocations to meet long-term goals. When a major central bank signals that its gold share is too low and proceeds to rebalance, the implication is clear for individual investors: allocation decisions are strategic and often independent of short-term price swings.
China’s most active month of buying in three years came as prices were moving both up and down in preceding months. That behavior highlights the difference between price timing and strategic allocation. For savers, the takeaway is to focus on long-term portfolio construction, not on trying to outguess day-to-day volatility.
Market participants will watch upcoming data releases — including official SAFE disclosure for August purchases and short-term economic indicators — for additional signals. These near-term datapoints can influence price momentum, while the reserve rebalancing program remains a persistent, multi-year theme.
Stay On Top of Gold & Silver Prices
Get important market alerts sent straight to your inbox.
SOURCES
1. People’s Bank of China / State Administration of Foreign Exchange — Official Gold Reserve Data, July 2026, August 7, 2026
2. Bloomberg — China’s Central Bank Adds 20 Tons to Gold Reserves in July, August 7, 2026 (news report)
3. World Gold Council — Central Bank Gold Reserves Survey 2026
4. U.S. Bureau of Labor Statistics — Consumer Price Index, July 2026, August 12, 2026
5. World Gold Council — Global Gold ETF Holdings and Flows, July 2026
6. The Private Banker — China’s Gold Reserves Climb Nearly 20 Tons in July, August 7, 2026
7. GoldSilver — Live Gold and Silver Spot Prices, August 12, 2026
Disclaimer: This article is for informational purposes only and does not constitute investment advice. Past performance is not indicative of future results. Always consult a qualified financial advisor before making investment decisions.
You May Also Like:
- Five Unrelated Forces All Moved Gold and Silver Higher Today. That Doesn’t Happen Often.
- Gold Climbs 1% Ahead of July CPI. Here Is Why the Print Matters More Than the Number.
- Why Gold Rose While the World’s Biggest Gold Miner Fell
- Gold Is Flat. Silver Is Down 2.3%. The Ratio Just Told You What to Watch Tomorrow.
- Gold Slipped at the Open. China Bought the Dip. Again.
- Why Is Silver Outperforming Gold Today? The Dual-Engine Mechanism Explained.