What’s Driving Gold’s Sharpest Price Pullback This Year
🌆 Evening News Nuggets | Top updates for gold and silver investors
March 23rd, 2026 | Brandon Sauerwein, Editor
Markets reacted to a sharp gold pullback, renewed geopolitical friction around the Strait of Hormuz, and a surprising sign of resilience in silver. Here’s what investors should watch and why it matters.
No Deal, No Dialogue: Iran Doubles Down on Hormuz Closure
Iran publicly rejected recent descriptions from U.S. officials that talks had gone well, issuing a firm denial and reiterating that it will not enter negotiations until its stated conditions are met. The Foreign Ministry emphasized that Tehran’s stance remains unchanged: the Strait of Hormuz will be closed to countries Iran considers hostile or engaged in attacks against it.
Ibrahim Rezaei, spokesman for the National Security and Foreign Policy Committee in the Iranian Parliament, increased the rhetorical pressure by framing the U.S. response as inadequate and declaring that Washington had “failed again.” That sharp divergence between the two sides—one claiming progress, the other denying any movement—adds a layer of geopolitical uncertainty that markets dislike.
For investors, the takeaway is clear: unresolved geopolitical risk increases the probability of episodic volatility across commodities and stock markets. Even if a diplomatic resolution emerges later, the immediate effect is heightened risk premium in energy and safe-haven assets. Monitor developments around the Strait of Hormuz closely, because any escalation or disruption to shipping there could quickly affect energy prices and influence broader market sentiment.
The Edge Every Investor Needs
Smarter precious metals investing starts here. The Nuggets Newsletter delivers market insights, central bank updates, global trends, and educational content tailored for gold and silver investors.
Why Is Gold Down So Much Right Now?
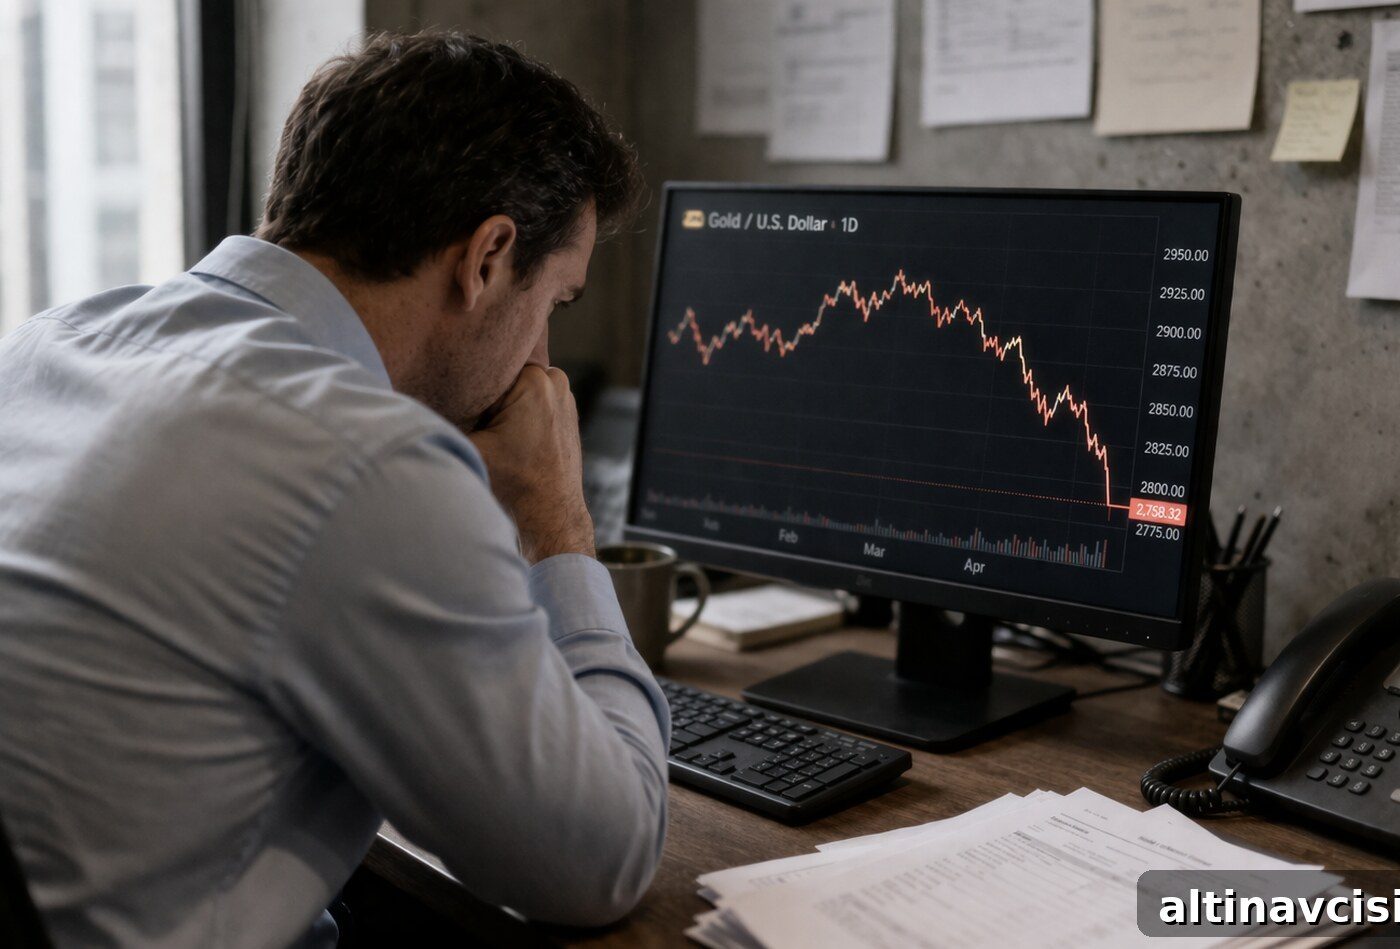
Gold fell about 2% today, settling near $4,406 per ounce. That move completes a sharp drawdown after an extraordinary run: roughly 10–12% down over five trading days and about 14% over the last month. While those numbers are eye-catching, the decline looks like a classic profit-taking and deleveraging episode rather than a structural reversal.
▲ +$1,395
+46.3% since Mar 2025
Peak: $5,414 · Jan 28, 2026
GoldSilver.com
This episode looks like a normal correction following a rapid, parabolic advance. When momentum-driven moves stall, leveraged positions unwind quickly and amplify the downside. That pattern explains much of the short-term selling pressure we saw over the past week.
Importantly, the fundamental case for gold remains intact. Dollar weakness persists—DXY is near 99.3—and central bank demand has not disappeared. The macro drivers that supported gold during its climb to new highs remain in place. For long-term holders, this is more a pause than a pivot: the question for investors is whether the structural conditions that pushed gold higher have reversed. At present, there is no clear evidence they have.
Is Silver Sending a Bullish Signal?
Silver bucked the broader precious metals move, gaining about 2.4% today to trade near $69 per ounce while gold slid. That relative strength is notable because silver often leads or confirms changes in market breadth when speculative flows shift.
When silver outperforms during a gold pullback, it can indicate the selloff is losing momentum. Speculative capital tends to exit gold first; if silver holds or rises, it often reflects continued physical and industrial demand that supports a floor. The gold-to-silver ratio sits roughly in the 63–65 range and is compressing. Historically, a falling ratio has preceded silver rallies, and at current levels silver remains inexpensive relative to gold on a historical basis.
That said, silver’s short-term chart has been volatile—down roughly 20% over the last 30 days—so any stabilization should be confirmed by follow-through buying. Investors should watch volume and the ratio movement for clues about whether silver can maintain its relative strength.
Stay On Top of Gold & Silver Prices
Receive timely market alerts and concise analysis directly to your inbox.
You May Also Like
- Stagflation and Gold: Why the Selloff Doesn’t Tell the Whole Story
- Gold Price Drops After Oil Shock — What’s Really Driving It
- Why Is Gold Falling While a War Is Raging?
- Gold Price Outlook: Fed Holds, PPI Climbs
- Gold Price Today Holds at $5,000 — What’s Driving It
Popular Topics
Picked from the archive
-
01
 Topics
Crude Oil Drops Below $68 After Peace Deal, OPEC+ Boost
-
02
Topics
Dollar Index Breaks 200-Day Average and Sparks Silver Rally
-
03
Topics
Gold Rises 0.3% as Dollar Weakens Amid Tax and Trade Uncertainty
-
04
Topics
Treasury Yields Jump After May Inflation Tops Estimates at 2.7%
-
05
Topics
Gold Prices Stall Ahead of Ukraine Peace Talks and Fed Signals
-
06
Topics
Newmont Beats Earnings Estimates After 40% Gold Rally
-
07
Topics
Powell: Fed Dollar Swap Lines to Stay Amid Political Uncertainty
-
08
Topics
Gold Purchasing Power: What an Ounce Could Buy Over Time