Gold opened above $4,400 for the fourth straight session today after softer inflation readings, but the metal is consolidating rather than breaking out. The July Producer Price Index (PPI) was unchanged versus a consensus of +0.2%, and the July Consumer Price Index (CPI) rose just 0.1% the day before. Those two successive soft prints would ordinarily encourage a stronger push higher for gold. Yet the market is pausing. Below we explain the reasons in clear, practical terms for investors and traders.
What Did the July PPI Actually Show?
The U.S. Bureau of Labor Statistics released the July Producer Price Index on August 13. On a seasonally adjusted basis, final demand prices were flat for the month, which missed the expected +0.2% and marks a second month of easing: June was revised to a 0.1% decline and July printed zero.
However, the headline flatness masks important internal detail. Goods prices fell 0.7% in July, driven largely by a 3.1% drop in energy. That decline pulled the headline lower. At the same time, core PPI — which excludes food, energy, and trade services — rose 0.4% for the month. In short, goods are soft while services continue to move higher.
That distinction matters for Fed watchers. The Federal Reserve pays particular attention to core measures when assessing underlying inflation pressures. On an annual basis, headline PPI still rose 4.7% in July, meaning inflation remains well above the Fed’s 2% target. The data therefore paints a mixed picture: easing headline inflation offset by stickier core components.
The Edge Every Investor Needs
Smarter precious metals investing starts here. The Nuggets Newsletter brings essential market insights, Fed updates, global trends, educational videos, and more.
Why Did Soft CPI Also Fail to Break Gold Through $4,500?
Wednesday’s CPI report for July showed consumer prices rising 0.1% for the month, in line with expectations. Year-over-year headline CPI eased slightly to 3.4% from 3.5% in June, and core CPI increased 0.2% month-over-month and 2.5% year-over-year — the slowest annual core pace since March 2021.
On the surface, that should be bullish for gold: softer inflation reduces the pressure on the Federal Reserve to pursue further rate hikes, which typically lowers real yields and weakens the dollar — both supportive for gold. In practice, however, “soft” is not the same as “complete disinflation.” Energy prices remain elevated — roughly 14.7% higher year-over-year — and real wages are not yet clearly outpacing inflation. The Fed has not signaled that the job is finished, and markets remain cautious.
As a result, gold traded within a range rather than staging a rapid breakout toward $4,500. Investors require clearer evidence that inflation pressures are sustainably easing across both goods and services before committing to a new wave of price discovery for the metal.
What Is the One Number Keeping Gold Below $4,500?
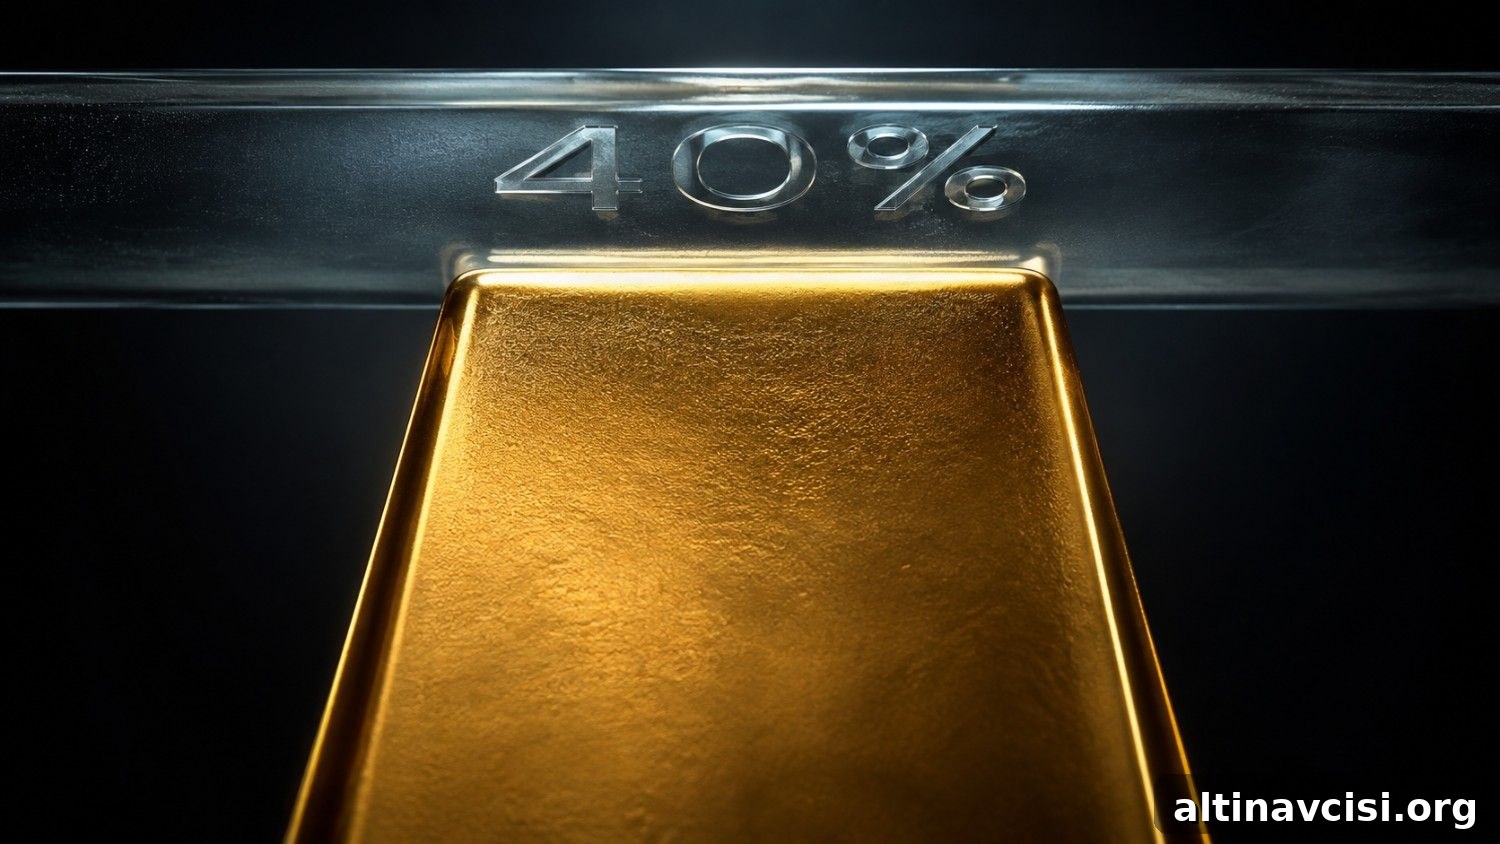
The key figure is the market-implied probability that the Federal Reserve will raise rates at the September meeting. That probability currently sits near 40% according to futures-based measures. A week earlier it was closer to the mid-50s. The back-to-back soft CPI and PPI prints have trimmed the odds, but not eliminated them.
As long as roughly 40% of market participants price in a September hike, the dollar retains support and real yields remain elevated. Gold cannot fully price in a “Fed on hold” scenario while a sizable portion of the market still expects tightening. This unresolved probability acts as a tactical ceiling for the metal until the odds shift decisively lower.
CME FedWatch Tool
September Fed Rate Hike Probability
Trailing 30 days · July 14 – August 13, 2026
Hike probability
Key event (representative)
30% watch threshold
Source: CME Group FedWatch Tool. Market-implied probability of a 25 bps rate hike at the September 16, 2026 FOMC meeting, derived from fed funds futures pricing. Key events this period included the July 29 FOMC, an August NFP miss, CPI in-line on Aug 12, and a flat PPI on Aug 13.
The mechanics are simple: gold benefits when real yields compress — nominal yields fall faster than inflation expectations — and when the dollar weakens at the same time. Those two factors drive both physical demand and monetary demand for gold. Until the market meaningfully reduces the probability of a September hike, neither condition is reliably in place.
Why Can’t Gold Simply Ignore the Fed and Move Higher on Its Own?
Gold can and does move higher on its own at times: since the July low near $3,963 the metal is roughly 11% higher, reflecting a recovery from an earlier correction. That rally shows the structural bullish forces at work: rising ETF holdings, consistent central bank purchases, and limited mine supply growth.
But there is a difference between a recovery and a breakout into new price discovery. Breaking significant technical resistance — for example the area around $4,500, where some analysts note the 200-day moving average — requires sustained changes in macro conditions. Those changes are most commonly delivered when markets decisively price out further rate hikes, not when hike odds merely decline modestly.
Structural demand remains supportive: ETF holdings have risen to recent highs, and central banks (notably the People’s Bank of China) continued to add to reserves in July. On supply, gold mine production has averaged less than 1% annual growth over the past decade, supporting the long-term scarcity case. Monthly inflation prints do not alter those structural trends, but they do influence the tactical environment that governs near-term price discovery.
What Number Should Gold Investors Actually Watch?
The most actionable number to monitor is the CME FedWatch probability for a September rate hike, updated in real time after each new data release. Currently near 40%, the probability must drop below roughly 30% for the historical conditions that support sustained gold advances to align: a weaker dollar, compressing real yields, and renewed ETF inflows.
Key upcoming inputs include the August CPI report (due September 11) and the central-bank-focused speeches at Jackson Hole, notably the Fed chair’s address on August 27. When Fed communication is intentionally opaque — as when the chair describes a keynote as “a blank piece of paper” — uncertainty lingers and gold often benefits as investors seek protection outside fiat assets.
Remember that the structural case for physical gold does not hinge on any single monthly report. Headline PPI may be flat month-to-month, but the annual rate sits at 4.7%. Fiscal deficits, central bank balance sheet dynamics, and the persistent real-interest-rate backdrop remain relevant. One soft PPI print clarifies the near-term tactical ceiling, but it does not negate the long-term fundamentals that support gold ownership.
Stay On Top of Gold & Silver Prices
Get important market alerts sent straight to your inbox.
SOURCES
1. U.S. Bureau of Labor Statistics — Producer Price Indexes, July 2026 (USDL-26-1380), released August 13, 2026.
2. U.S. Bureau of Labor Statistics — Consumer Price Index, July 2026 (USDL-26-1378), released August 12, 2026.
3. CME Group — FedWatch Tool, September 2026 FOMC rate probability, August 13, 2026.
4. Federal Reserve — FOMC Statement, July 29, 2026.
5. World Gold Council — Gold ETF Flows, July 2026.
6. World Gold Council — Gold Mine Supply Data (January 2026).
7. Federal Reserve Bank of Kansas City — Jackson Hole Economic Policy Symposium 2026 (August 27–29).
8. GoldSilver — Live Gold & Silver Spot Prices.
Disclaimer: This article is for informational purposes only and does not constitute investment advice. Past performance is not indicative of future results. Always consult a qualified financial advisor before making investment decisions.
You May Also Like:
- China Bought the Most Gold Since 2023 in July — Here’s Why.
- Five Unrelated Forces All Moved Gold and Silver Higher Today. That Doesn’t Happen Often.
- Gold Climbs 1% Ahead of July CPI — Why the Print Matters More Than the Number.
- Why Gold Rose While the World’s Biggest Gold Miner Fell.
- Gold Is Flat. Silver Is Down 2.3%. The Ratio Just Told You What to Watch Tomorrow.
- Gold Slipped at the Open. China Bought the Dip. Again.