Many readers appreciated the tables we shared showing possible silver/S&P 500 ratios and their implications for both assets. If you missed the gold vs. stock market comparison, it’s worth reviewing that context as well.
Given recent moves in equities and precious metals, I decided to run the same kind of scenario analysis for silver. In short: what would silver and the S&P 500 be worth if the silver/S&P 500 ratio returned to any of its notable past highs?
Hold on, because the results are striking.
Why Examine the Silver/S&P 500 Ratio?
Silver does not behave as consistently inverse to the S&P 500 as gold does. While stocks often decline when gold rises, silver’s pattern is more mixed. Because of its substantial industrial demand, silver can be affected by factors that do not influence gold in the same way. In fast, severe market crashes, silver has at times fallen alongside equities rather than acting as a safe haven.
Still, there are clear forces that can push silver and stocks in opposite directions: monetary policy shifts, flight-to-safety flows, inflation expectations, and broader macroeconomic concerns. Since the 1970s, there have been multiple episodes where silver and stocks reacted differently to major events, and during those stretches the silver/S&P 500 ratio climbed to notably high levels.
One of the most important reasons to consider the ratio now is the current divergence in prices. Stocks have spent roughly a decade reaching new highs (even after recent softness, the S&P is up year-to-date). By contrast, silver has endured a prolonged bear market that has left many primary producers struggling to turn a profit.
Because these two assets sit at opposite extremes, even a modest rise in the silver/S&P 500 ratio could coincide with a meaningful reversal in equity values and a substantial rally in silver prices.
Silver/S&P 500 Ratio Past and Present
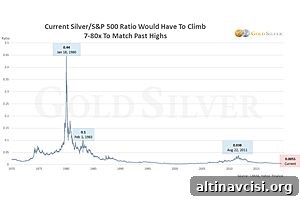
Below is a summary of the 50-year behavior of the silver/S&P 500 ratio. Several historic highs are notable, and the current reading (as of the end of July) sits near the bottom of the long-term range.
The current ratio of approximately 0.0055 is close to long-term lows, exceeded only by readings seen in the late 1990s/early 2000s and the early 1970s. To reach prior peaks, the ratio would need to rise dramatically—anywhere from roughly sevenfold to more than eightyfold, depending on which historical high you use as the benchmark.
With that context, let’s look at how various ratio reversals would translate into silver prices and S&P 500 levels.
Ratio Reversals: Victim or Victor
Using a straightforward framework—3,000 for the S&P 500 and $16.50 for silver as current reference points—we can see the implications if the silver/S&P 500 ratio climbed back to selected historical peaks. These scenarios illustrate potential gains in silver alongside potential losses in the S&P 500.
First, consider a return to the 2011 ratio high near 0.038. Because current prices are so polarized, there is no scenario within this framework where the S&P 500 avoids meaningful declines if the ratio moved that far upward. For instance, if silver rose to $50 (a bit more than triple today’s price), the S&P 500 would lose over half its value. Based on historical precedent, this outcome is not implausible.
Next, imagine the ratio matching its 1983 high of around 0.10. At that level, the S&P 500 would lose a substantial portion of its value in every plausible scenario. If silver climbed to $100—a roughly sixfold increase from current levels—common stocks could see losses on the order of two-thirds. Even a $50 silver price at this ratio would imply an equity decline exceeding 80% from the starting point.
Finally, consider the extreme 1980 peak near 0.44. This scenario represents an almost complete devastation of stock market value within our simplified framework. Silver would be extraordinarily high relative to equities, leaving very little remaining value in common stocks. While extreme, this outcome underlines how historic ratio peaks have coincided with dramatic shifts in relative asset values.
It is important to emphasize that these scenarios are not fanciful projections. Each of the ratios used above has occurred historically. With the ratio currently near record lows, the likelihood of it moving substantially higher over time is arguably elevated.
What should investors take away from this analysis? First, a large rally in silver relative to stocks would likely coincide with material losses for equities. Second, dramatic ratio shifts can provide clear signals for rebalancing: in an extreme move toward one of the historical highs, silver and gold could become overvalued relative to stocks, creating an opportunity to rotate into out-of-favor equities.
Are you prepared for such a reversal? If you are considering increasing exposure to silver in anticipation of a major ratio correction, common ways to acquire physical metal include mint products such as Silver Eagles or larger-format bars. Choose the form that best fits your goals and storage preferences.