Gold’s Worst Week of 2026 as Central Banks Signal Record Buying
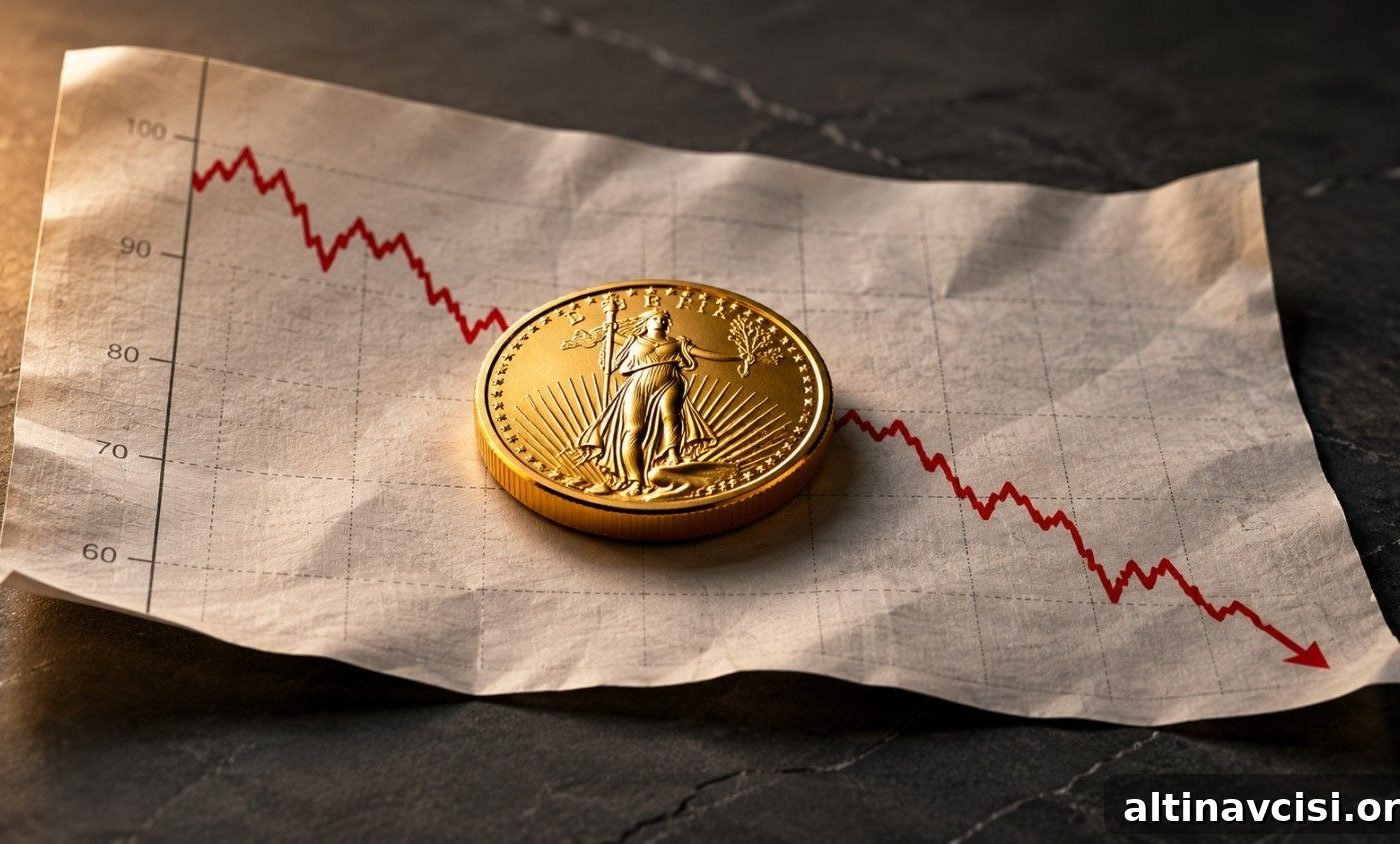
Gold dropped about 5% this week to $4,044 per ounce — its steepest weekly decline so far in 2026. At the same time, central banks are signaling the opposite: they continue to add to gold holdings. The World Gold Council’s Central Bank Gold Reserves Survey (published June 16, 2026), which collected responses from 76 institutions, found that 89% of reserve managers expect global gold reserves to rise over the next 12 months, and a record 45% plan to increase their own holdings. That is the strongest bullish reading in the survey’s nine-year history.
Two data points, one week — they point in different directions. Understanding why they diverge reveals more about gold’s long-term outlook than any single short-term price move.
Why the Paper Market Sold Off
Last week’s sell-off was largely mechanical. The Bureau of Economic Analysis reported May PCE inflation at 4.1% year-over-year, the highest reading since April 2023. That print, released Thursday June 25, combined with a stronger Q1 GDP report and firm jobless-claims data, renewed expectations that the Federal Reserve may keep policy tighter for longer. The CME FedWatch Tool priced roughly a 63% chance of a September rate hike and about an 80% chance of at least one increase before year-end.
Rising rate-hike odds push up the opportunity cost of holding gold, which pays no yield. Futures and other paper-market positions that had been positioned for falling rates found themselves exposed to a new pricing environment and were quickly sold. The U.S. dollar strengthened toward its 52-week highs, and gold’s paper price declined in response.
This dynamic is familiar: when the expected policy path turns more hawkish, leveraged and short-horizon participants in the paper market trade accordingly, often moving prices sharply in the short run. It is a market-mechanism story, not a structural break in gold’s fundamentals.
There was nuance in the PCE release: Core PCE, which excludes food and energy, rose to 3.4% — the highest since October 2023 but broadly in line with expectations. After the data, the market-implied odds of a September hike slipped slightly from 68% to 63%, and gold recovered modestly on Friday from intraweek lows near $3,970.
What the Survey Actually Says
The World Gold Council’s Central Bank Gold Reserves Survey is an annual, strategic snapshot. Central banks manage reserves over decades, not over weekly economic prints. The survey therefore captures long-term reserve intent rather than short-term trading reactions.
Three findings from this year’s survey are particularly meaningful for investors and policymakers.
First: Participation in the survey reached a record. Seventy-six central banks responded — the largest sample in the report’s nine-year run. That breadth underscores that gold has become a mainstream consideration in reserve management, not a niche holding.
Second: Conviction is rising. A record 45% of respondents said they plan to increase gold reserves in the next 12 months, up from 43% in 2025. The trend has been consistently upward; very few central banks expect to reduce holdings.
Third: Reserve managers are deliberately reducing dollar exposure. According to the survey, 74% of respondents expect the U.S. dollar’s share of global reserves to decline moderately or significantly over the next five years, while gold’s share is expected to rise. This reflects deliberate strategic reallocation decisions rather than short-term currency forecasts.

The Edge Every Investor Needs
Smarter precious metals investing starts here. The Nuggets Newsletter delivers market insights, Fed updates, global trends, and clear educational content.
Gold Now Outranks US Treasuries as the World’s Largest Reserve Asset
The survey arrives at a historically notable moment: gold has surpassed U.S. Treasuries as the largest reserve asset globally, according to the European Central Bank’s June 2, 2026 report on international reserves. Foreign central banks now hold roughly $4.5 trillion in gold compared with about $3.5 trillion in U.S. government bonds. That shift reflects both rising gold prices — which increase the market value of existing holdings — and continued sovereign buying.
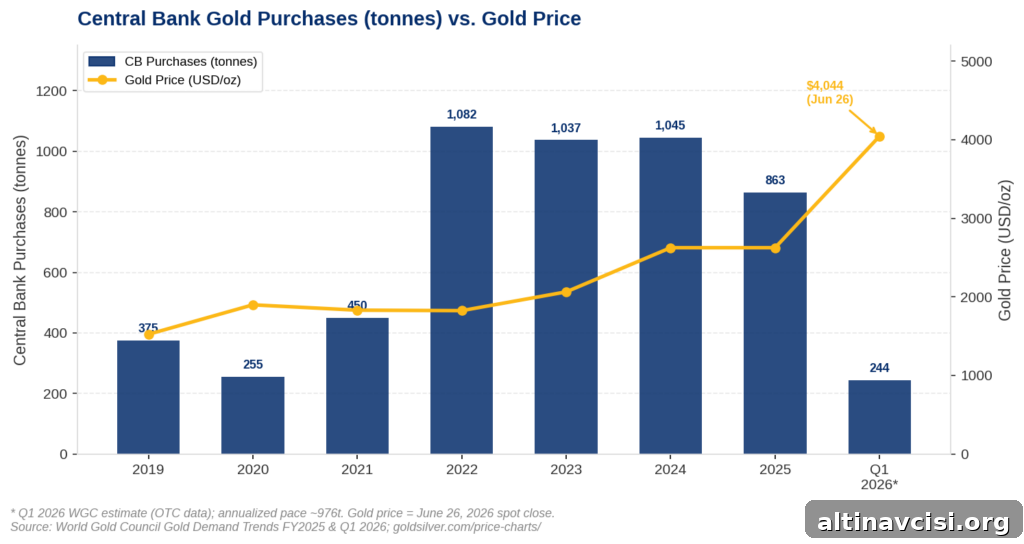
Central banks have been steady buyers. The People’s Bank of China, for example, has reported additions to its gold reserves for 20 consecutive months. The World Gold Council’s Gold Demand Trends data estimated central bank purchases at roughly 850 tonnes for 2026, consistent with 2025’s 863 tonnes and well above the 2010–2021 annual average of about 473 tonnes.
Two Markets, One Metal
There are effectively two markets for gold today, operating on very different time horizons. Recognizing this distinction resolves the apparent paradox of a falling spot price alongside record bullishness among central banks.
The paper-gold market — futures, ETFs, options — is dominated by institutional traders, hedge funds, and algorithmic strategies that respond to monetary policy expectations, dollar moves, and short-term opportunity costs. When the expected rate path becomes more hawkish, these players can sell quickly and at scale, driving short-term price moves.
The central-bank market follows a different mandate. Sovereign reserve managers are not trading for short-term gains; they allocate based on long-term goals such as diversification, liquidity, and protection against currency or inflation risk. Their buying decisions are strategic and largely indifferent to a single monthly inflation report.
Data bear this out. The World Gold Council estimated central bank net purchases at about 244 tonnes in Q1 2026, based on London OTC market flows. That quarterly total exceeded Q4 2025 and outpaced the recent five-year average. Importantly, central banks made these purchases at prices that were already near record levels, demonstrating a structural preference rather than price-timing behavior.
In short: short-horizon traders pressured the price this week while long-horizon sovereign buyers confirmed they remain active.
What It Means for the Long-Term Holder
If you hold physical gold — bars, coins, or stored bullion — a one-week paper-market move changes the quoted price but not the metal you own. Physical ounces have no counterparty risk, cannot be margin-called, and remain the same tangible asset week to week.
The paper price today sits roughly 28% below the January 28 all-time high of $5,589. That is still a level where central banks — collectively managing trillions in public wealth — see strategic value. The WGC survey does not predict three-month price action, nor does a daily quote tell you the long-term trajectory. What both data points do illustrate is who is buying on five-year horizons (sovereign reserve managers) and who is trading on five-day horizons (paper-market participants).
Reserve managers are focused on structural issues: an expanding U.S. national debt, shifting reserve currencies, and gold’s historical record as a store of value through multiple monetary cycles. These considerations underpin a stable, long-term bid in the market. In practical terms: the paper market moves prices day to day; the central-bank market helps establish a durable price floor over the long run.
Stay On Top of Gold & Silver Prices
Get important market alerts sent straight to your inbox.
SOURCES
1. World Gold Council — Central Bank Gold Reserves Survey 2026; Gold Demand Trends Q1 2026; Gold Demand Trends Full Year 2025
2. Bureau of Economic Analysis — Personal Income and Outlays, May 2026 (PCE)
3. CME Group — FedWatch Tool (market-implied policy probabilities)
4. Federal Reserve — FOMC statement and projections, June 17, 2026
5. Gold price data and spot charts (industry sources)
6. U.S. Treasury Fiscal Data — Debt to the Penny
Disclaimer: This article is for informational purposes only and does not constitute financial or investment advice. Consult a qualified financial adviser before making investment decisions.
You May Also Like:
- Silver Looks Like It’s Losing. The Ratio Says It’s Loading.
- Q1 GDP Beat. Jobless Claims Beat. Gold Rose. Here’s Why.
- PCE Hit 4.1%. Gold Went Up. Here’s Why.
- 298 Tonnes of ETF Gold Is Underwater. Central Banks Aren’t.
- Hawkish Fed, Gold Below $4,000, Silver Below $60 — and a Market That Disagrees.
- Gold Just Broke $4,000. The Mainstream Called the Debasement Trade Dead. They’re Wrong.
- Two Things Are Hitting Gold Simultaneously. Only One Is About Gold.
Popular Topics
Picked from the archive
-
01
 Topics
Warsh Says Inflation Too High but Risk Is Fading, Gold Reacts
-
02
Topics
Gold Price Falls to $4,681 as Iran Ceasefire Ends Today
-
03
Topics
Gold Falls After U.S. Wholesale Prices Surge
-
04
Topics
Factory Cost Index Hits 82.1: Why It’s Driving Gold Prices
-
05
Topics
Gold Steadies After 1.8% Drop as Tariffs Raise Inflation Worries
-
06
Topics
February 2026 CPI Report: Inflation Calm Before Oil Shock
-
07
Topics
Why Silver Dropped 3.3% vs Gold’s 1.6%: The Gap Explained
-
08
Topics
CPI 3.3% and GDP Stalling: Is 2026 Stagflation Coming?