
The University of Michigan published its preliminary Consumer Sentiment Index for August at 10:00 a.m. ET on Friday, and the result came in significantly below forecasts. The index registered 51, well under the consensus expectation of 54.5 and below July’s final reading of 55.2. That represents roughly an 8% decline in a single month and undoes two months of steady improvement in consumer mood.
At the same time, one-year inflation expectations edged higher, rising to 4.3% from 4.2% in July. That combination — weaker confidence about the economy alongside rising price expectations — is the hallmark of stagflation, a scenario closely watched by investors in precious metals.
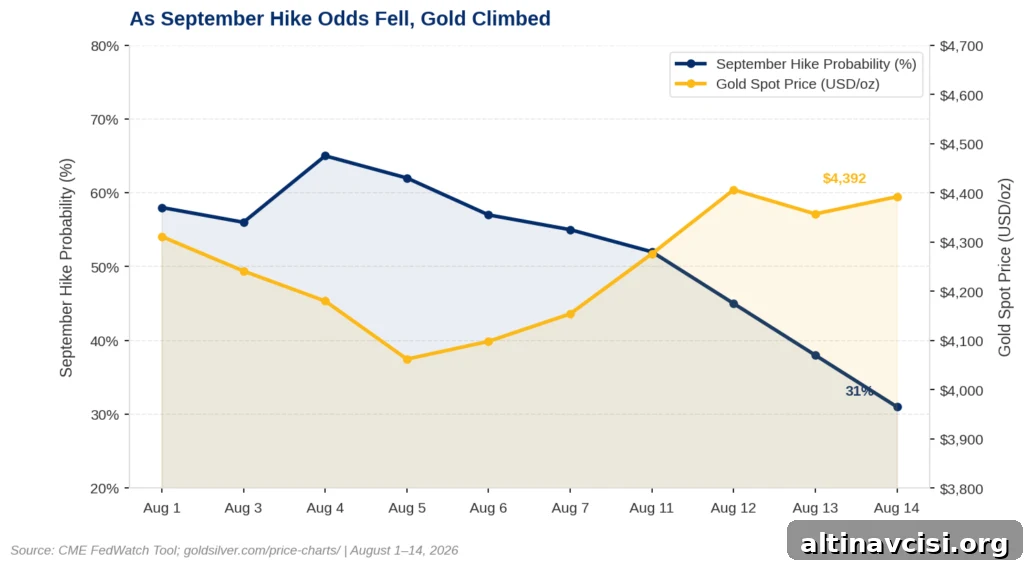
When the University of Michigan data arrived at 10:00 a.m., it changed the market tone. Earlier in the session, spot gold had dropped to a session low near $4,311. After the sentiment report, gold rebounded sharply and traded closer to $4,392 by mid-morning. Silver moved in the same direction, trading near $65.29 as markets adjusted to the new information.
What Does the University of Michigan Consumer Sentiment Index Actually Measure?
The University of Michigan’s Surveys of Consumers tracks two main elements: how households view their current financial situation and what they expect for the economy over the next six to twelve months. The survey also records consumers’ inflation expectations, reflecting what people believe prices will do in the coming year.
When sentiment weakens while inflation expectations increase, the survey signals a specific economic condition. Consumers feel less confident about the near-term and long-term outlook, yet anticipate higher prices. This pattern is not necessarily a direct signal of recession by itself. Instead, it aligns with stagflation — slower growth combined with persistent inflation.
“Consumer sentiment fell about 8% this August, ending two consecutive months of improvement,” said Joanne Hsu, Director of Surveys of Consumers at the University of Michigan. “While views of personal finances saw only minor declines, expected business conditions sank 11% for the short run and 17% for the long run.”
That 17% decline in long-run expectations is especially meaningful. It indicates consumers are not only worried about the next few months; they are reassessing the economic prospects for several years ahead.
The Edge Every Investor Needs
Smarter precious metals investing starts with clear information. The Nuggets Newsletter delivers market insights, policy updates, global trends, and educational content to help informed decisions.
Why Does This Combination Matter for Gold?
Gold reacts differently depending on economic conditions. In a typical recession, growth fears dominate, real yields fall, and gold usually benefits. In a strong inflationary environment, central banks tend to tighten policy, real yields rise, and gold can face headwinds. Stagflation is distinct because it forces central banks into a difficult trade-off: tightening to combat inflation risks deepening an economic slowdown consumers are already expecting.
That policy dilemma tends to support gold over time. If the Fed cannot tighten aggressively because economic growth is fragile, real yields can remain low or compressed. Non-interest-bearing assets like physical gold become relatively more attractive in that environment. Simultaneously, higher inflation expectations reinforce the argument for holding an asset that helps preserve purchasing power outside of traditional financial instruments.
This morning’s sentiment report made that policy bind more visible. The preliminary August reading arrived just hours after July retail sales showed a notable 0.6% decline — the largest monthly drop in more than a year. Along with earlier weak inflation indicators for the month, the week’s data collectively point to a softer economy than many had anticipated.
Markets responded. The implied probability of a Federal Reserve rate increase at the September meeting fell sharply. Where a week ago roughly half of participants expected a 25-basis-point hike, market pricing later in the week reflected a much lower chance, leaving most participants expecting policymakers to hold rates steady.
What Are Sound Money Investors Watching Right Now?
For investors holding physical gold and silver with a multi-year horizon, short-term price moves provide context but do not necessarily change the core investment thesis. Knowing why prices move on any given week helps identify which part of the broader case is at work: liquidity preferences, real yields, or inflation expectations.
The purchasing-power argument for gold does not depend on an economic collapse. It relies on a steady trend where prices consistently rise faster than incomes, eroding real purchasing power. That is the condition many consumers describe in surveys. When official data aligns with household experience, it narrows the gap between theoretical reasons for holding sound money and the lived reasons people buy it.
Silver shares similar long-term support from inflation and real-yield dynamics, with the added dimension of industrial demand. When the economy stabilizes, silver’s industrial use can help it outperform. Currently, the gold-silver ratio sits near historically elevated levels; historically, such elevations have often resolved with periods of stronger silver performance relative to gold.
Key near-term events to watch include the release of the FOMC minutes from the July 28–29 meeting. Those minutes will shed light on how much appetite remains within the committee for a September rate move, independent of market-implied odds. For investors, minutes and other commentary can clarify whether the central bank leans hawkish or prefers to wait for clearer signs on growth and inflation.
For now, the data speaks: two months of improving consumer sentiment ended this morning, and that reversal came with rising inflation expectations. The combination narrows policy options and reinforces the reasons many investors hold precious metals as part of a broader portfolio.
Stay On Top of Gold & Silver Prices
Get important market alerts sent straight to your inbox.
SOURCES
1. University of Michigan, Surveys of Consumers — Preliminary August 2026 Consumer Sentiment Release.
2. US Census Bureau — Advance Monthly Retail and Food Services Sales, July 2026.
3. CME Group — FedWatch Tool, September 2026 rate probabilities, August 14, 2026.
4. Bureau of Labor Statistics — Consumer Price Index Summary, July 2026.
5. Bureau of Labor Statistics — Producer Price Index Summary, July 2026.
6. Federal Reserve — FOMC Statement, July 29, 2026.
7. GoldSilver — Live Gold and Silver Spot Prices, August 14, 2026.
Disclaimer: This article is for informational purposes only and does not constitute investment advice. Past performance is not indicative of future results. Always consult a qualified financial advisor before making investment decisions.
You May Also Like:
- Gold Price and the September Fed Pivot: Five Data Prints Rewrote the Odds This Week
- The Fed’s September Math Just Changed. Here’s What It Means for Gold.
- Jackson Hole Is 14 Days Away. What Warsh Says Could Move Gold More Than Any Inflation Print.
- Gold Hit a Two-Month High. Then It Pulled Back. The PPI Data That Caused Both Moves Is What Matters.
- Two Soft Inflation Prints. Gold Is Still Below $4,500. One Number Is Keeping It There.
- China Bought the Most Gold Since 2023 in July. Here’s Why.