Gold-Silver Ratio Hits 61.1: Silver Poised to Rally

Silver closed near $79 on Wednesday, rising more than 3% and outpacing gold for a second consecutive day. The single most important metric right now, however, is not silver’s price itself but the gold/silver ratio.
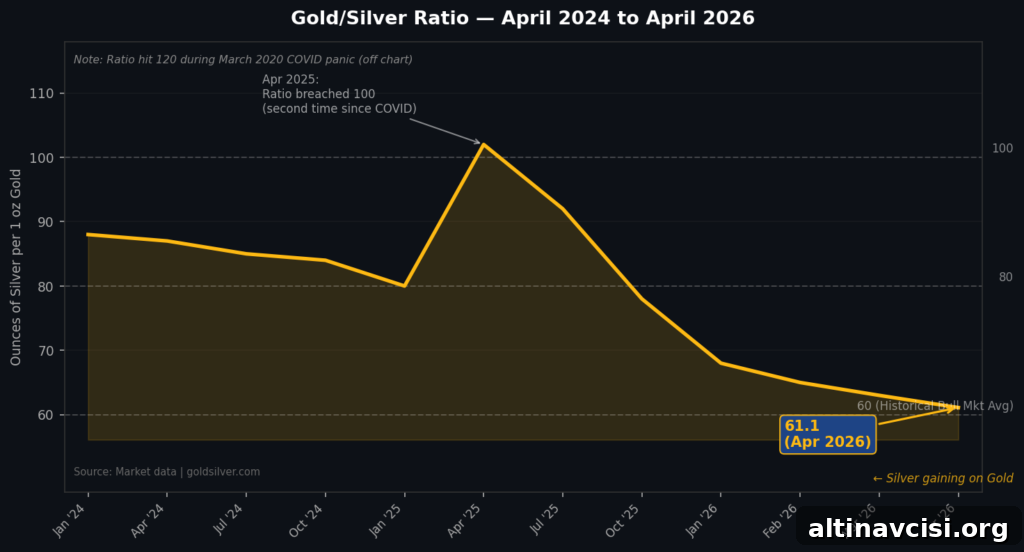
The gold/silver ratio has tightened to 61.1. For serious precious-metals observers, that number conveys meaningful information: silver is regaining ground versus gold, the metals bull market may be shifting into a more advanced phase, and the structural case for silver is beginning to assert itself.
What is the gold/silver ratio — and what does 61.1 actually mean?
The gold/silver ratio shows how many ounces of silver are required to buy one ounce of gold. At 61.1, the ratio is substantially lower than the extreme readings seen in recent years—around 120 during the March 2020 market panic, when silver plunged more sharply than gold, and above 100 as recently as April 2025.
Historically, sustained precious-metals bull markets have seen the ratio range roughly between 50 and 60. When the ratio falls toward that band, it often signals that silver is catching up to gold and that the market is entering a phase driven by structural demand rather than just monetary speculation.
Silver typically lags gold at the start of a bull cycle, then accelerates to close the gap—and sometimes overshoots. At 61.1, the catch-up trade appears to be unfolding.
What’s driving silver right now?
The immediate catalyst has been easing geopolitical tensions in the Middle East. The U.S. naval blockade of the Strait of Hormuz moved into a fragile ceasefire, which helped push oil back below $90 and eased risk-off pressure. A softer dollar—recently at a multi-week low—combined with reduced inflation fears tends to lift silver because it benefits from both weaker currency and improved risk sentiment.
But the ceasefire is only the short-term trigger. The deeper story is structural: persistent supply shortages and rising industrial demand.
Stay On Top of Gold & Silver Prices
Receive timely market alerts and updates to help you follow precious-metals trends.
Why has silver been in supply deficit for six straight years?
The market has underappreciated a sustained trend: six consecutive years of annual supply deficits documented by industry observers. Mine production has consistently lagged total demand, and the shortfall has been met by drawing down above-ground inventories. That inventory depletion is a finite process, and continued deficits tighten the market over time.
Demand drivers are becoming more structural. High-performance computing and AI data centers use more silver per server rack than older hardware because silver is critical for conductivity and thermal management in advanced components. Electric vehicles also increase industrial silver demand: EVs typically contain substantially more silver per vehicle than traditional internal-combustion models. This industrial baseline supports a durable price floor for silver independent of gold’s movements or short-term geopolitical events.
What does stagflation mean for precious metals — and are we already in it?
On April 14, the IMF revised its global outlook for 2026: growth downgraded to 3.1% and inflation raised to 4.4%. Slower growth combined with higher prices is the textbook definition of stagflation. In such an environment, conventional savings and investment vehicles often struggle—bonds lose purchasing power, equities face earnings pressure, and cash yields trail inflation.
History shows precious metals can perform well during stagflation. The 1970s, the last prolonged stagflationary decade in modern history, saw gold deliver very strong returns. Today, central-bank buying activity also matters: the People’s Bank of China expanded its gold holdings for many months, and wholesale withdrawals on the Shanghai Gold Exchange surged, reflecting strong local demand at elevated prices. Central-bank accumulation signals a shift away from dollar-denominated assets, a structural theme that supports precious metals over time.
Is gold’s rally sustainable above $4,800?
Gold hovered above $4,800 on April 15, trading well above pre-conflict levels and roughly 44% higher year-over-year at that point, despite a pullback from January highs. The important takeaway is resilience: even after some unwinding of the war premium, gold has not collapsed. A persistent structural bid—from central banks, ETFs, and retail savers—continues to support price levels. The tightening gold/silver ratio to 61.1 reflects growing recognition that silver remains relatively undervalued within the “sound money” pairing.
How far can the ratio compress from here?
At 61.1 the ratio is nearing its historical average but has not yet returned to the sub-50 levels typical of the most intense silver bull phases. The structural case is intact: multi-year supply deficits, rising industrial demand, and monetary pressures have not abated. Historically, once ratio compression gains momentum it often extends farther than many expect, especially when policymakers face the dual challenge of slowing growth and persistent inflation.
Gold remains supported above major levels, while silver is showing accelerating strength. The ratio has been compressing for months, and the next phase could bring further relative gains for silver.
SOURCES
International Monetary Fund — World Economic Outlook, April 2026; IMF press briefing transcript, April 2026. World Gold Council — China gold market update, March 2026. Silver Institute — report on consecutive annual silver market deficits and 2026 investment outlook.
By the GoldSilver Editorial Team — helping investors understand sound money since 2005. This article is informational and not financial, investment, or tax advice. Consult a qualified advisor before making investment decisions.
You May Also Like
- Silver Holds Near $80 as Iran Ceasefire Revives Rate-Cut Bets
- The Fed Goes Silent in 3 Days – What That Means for Gold
- Gold Is Down 10% From Its War Peak — and Still Up Strong Year-over-Year
- Gold Outranks the Dollar at Central Banks — Implications for Savers
- Hormuz Blockade Sent Gold Down — Why That Could Be Bullish
- Gold Jumps as Geopolitical Headlines Move Markets
- U.S. Debt Dynamics and Their Influence on Gold Prices
Popular Topics
Picked from the archive
-
01
 Topics
Citi Predicts Gold May Hit $3,500 After Weak Jobs Report
-
02
Topics
Gold Falls to $3,343 as Dollar Strengthens, Trade Optimism Grows
-
03
Topics
Gold & Silver Prices Today: Iran, Oil Fallout, $1.3B Bet
-
04
Topics
Top Economist Warns of U.S. Recession as Fed Options Shrink
-
05
Topics
How the Current Gold Rally Compares to Past Bull Markets
-
06
Topics
Bessent Urges 1.5% Rate Cut, Boosting Gold Prices
-
07
Topics
Gold Royalties Surge as Miners Struggle with Rising Costs
-
08
Topics
Is Gold Still a Safe Haven in War? Investor Insights