Gold-Silver Ratio Falling: What It Means for Investors
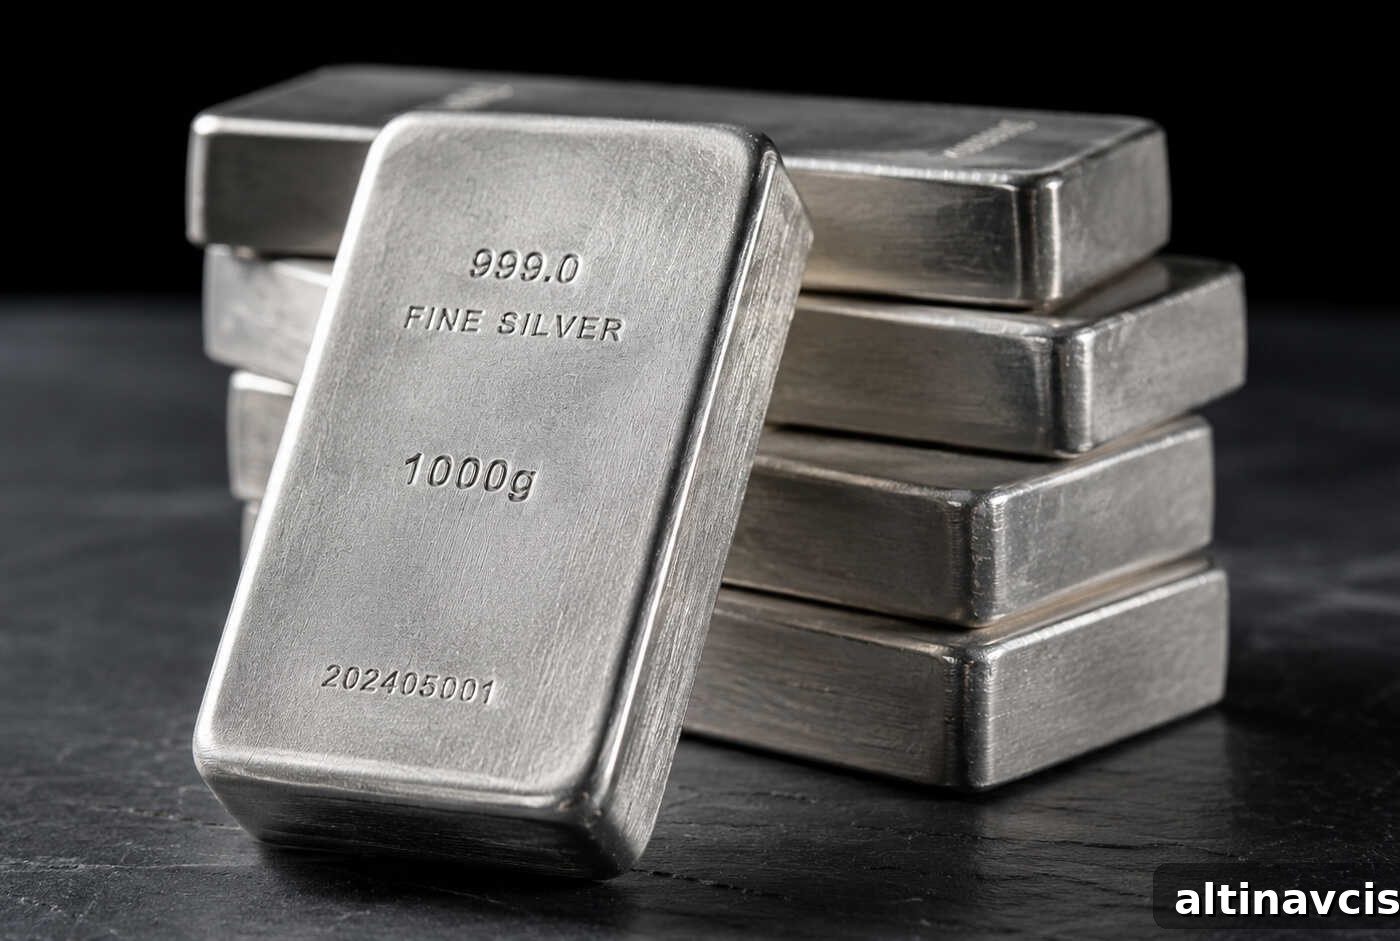
Gold and silver market update — May 11, 2026
Key Takeaways
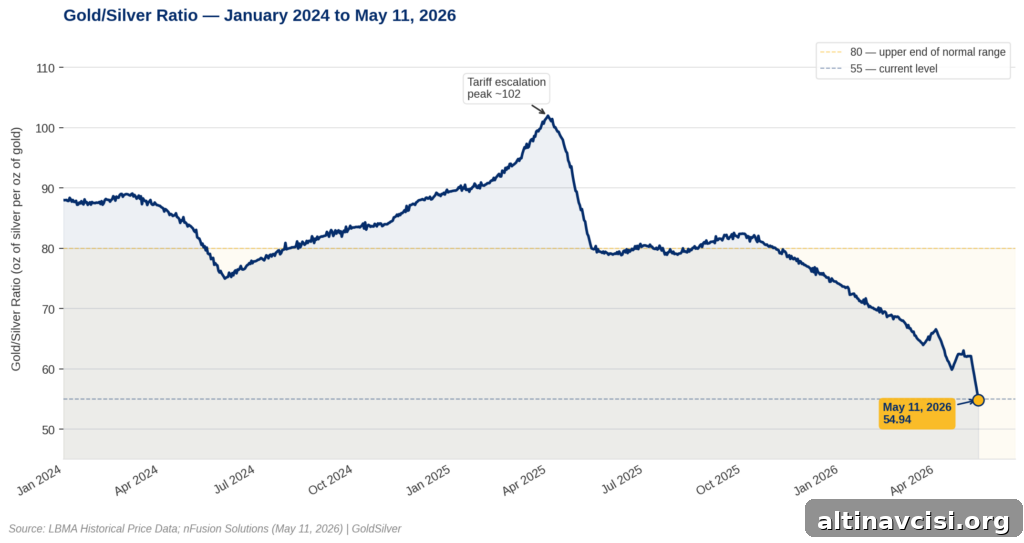
- The gold/silver ratio shows how many ounces of silver buy one ounce of gold. As of May 11, 2026 the ratio stood at 54.94, down sharply from 62.05 a week earlier.
- Silver surged 7.1% to $86.10 per ounce on the day while gold was largely unchanged around $4,730. The immediate catalyst was a US–China 90‑day tariff truce that materially improves silver’s industrial demand outlook (spot prices per nFusion Solutions, ~3:49 PM ET).
- The structural backdrop already favored silver: the Silver Institute reports six consecutive years of silver supply deficits, with roughly 762 million troy ounces drawn from above‑ground stocks since 2021.
The gold/silver ratio measures how many ounces of silver are required to purchase one ounce of gold. When the ratio falls, silver is outperforming gold. Over the last week the ratio compressed rapidly — from 62.05 to 54.94 — driven by a large silver rally after news of a temporary US–China tariff truce. Moves of this scale in such a short period are uncommon and typically occur when an external catalyst hits a metal that is already positioned to move. In silver’s case, the structural supply picture had been tight for years, which amplified the market’s reaction.
What Is the Gold/Silver Ratio — and What Does 54.94 Actually Mean?
The ratio does not give a buy or sell signal by itself; it provides relative-value context between the two metals. A ratio around 55 means one ounce of gold buys about 55 ounces of silver. In early 2024 the ratio was near 88, which implied silver was relatively cheap versus gold. Historically the ratio has tended to oscillate within a broad band — often roughly 40 to 80 in normal conditions — and extremes have tended to reverse. At 54.94, the ratio sits near the lower end of its historical range, which indicates silver has recovered substantial ground versus gold. That recovery is important context for investors, because moves out of these ranges can precede meaningful directional shifts.
A compressed ratio doesn’t automatically mean silver is due for a crash or a sustained rally; it simply shows silver has outperformed gold recently. Traders should interpret the ratio alongside demand/supply fundamentals, macroeconomic indicators and any specific catalysts affecting industrial usage.
Why Is Silver Outperforming Gold Right Now?
Two forces combined to lift silver this week: a near‑term trade catalyst and an ongoing structural deficit in supply.
First, the trade catalyst: the United States and China agreed to a 90‑day tariff truce that substantially reduced the tariff rates charged on many bilateral goods. For gold this news is largely neutral because gold’s price response is driven more by monetary and macro variables. Silver’s price, however, is sensitive to changes in industrial demand because roughly 60% of annual silver consumption goes to industrial applications — including solar panels, electric vehicle components, and semiconductors — much of which is connected to China’s manufacturing base. When tariffs were reduced, market participants quickly adjusted expectations for near‑term industrial demand and repriced silver accordingly, producing a sharp intraday move.
Second, the structural backdrop: the Silver Institute has reported supply deficits for six straight years. The 2026 deficit was projected to widen versus 2025, and cumulative draws on above‑ground stocks since 2021 amount to hundreds of millions of ounces. That long‑running imbalance meant the market was already short of significant inventories; the tariff truce acted as the immediate trigger that accelerated price discovery.
Has a Ratio This Low Ever Predicted a Bigger Silver Move?
Historical episodes show similar dynamics, though context matters. In March 2020 the ratio spiked to extreme levels amid pandemic panic, then compressed sharply as markets recovered and silver rallied. The 2020 episode began from a much more extreme starting point than today’s environment. The present move is notable for its speed rather than for the ratio’s absolute extremity. The key difference today is that the rally is backed by a sustained supply deficit; in 2020 much of the move was a reaction to an exceptional monetary and liquidity shock.
It’s important to acknowledge risks: a 90‑day truce is limited in duration and not the same as a durable trade agreement. If negotiations falter, some of the recent re‑rating of silver’s industrial demand could reverse, and the ratio might re‑expand. Still, multi‑year supply shortages do not disappear overnight, so the structural case for silver’s tighter market remains.
What Does the Ratio Tell Long-Term Precious Metals Holders?
For long‑term holders, the ratio is a useful gauge of how the two metals are trading relative to each other, rather than a day‑to‑day trading rule. Silver is a hybrid asset: it functions as a monetary metal in some contexts and as an industrial commodity in others. When real interest rates decline or monetary concerns rise, gold often leads. When industrial activity and demand pick up, silver can overshoot to the upside.
Today both influences are present to varying degrees: monetary conditions remain a backdrop while industrial demand—especially demand linked to China—has improved with the tariff truce. The ratio at 54.94 reflects silver’s catch‑up since early 2024, when it traded much weaker relative to gold. That catch‑up is consistent with the mechanics of fiat currency systems, where both gold and silver act as stores of value, but they do not move identically. The ratio simply records that divergence and convergence over time.
Prices as of May 11, 2026, approximately 3:49 PM ET.
Stay On Top of Gold & Silver Prices
Get important market alerts sent straight to your inbox.
SOURCES
1. nFusion Solutions — Spot Price Data
2. Silver Institute — World Silver Survey 2026
3. White House — US‑China Trade Statement, May 2025
4. London Bullion Market Association — Historical Precious Metals Price Data
Disclaimer: This article is for informational purposes only and does not constitute financial or investment advice. Consult a qualified financial adviser before making investment decisions.
You May Also Like:
- What’s Moving Gold Prices This Week: CPI, Seoul & Beijing
- Silver Jumps 6% Before Trump‑Xi Summit — Here’s Why
- April Jobs Beat 115K. Gold Held. The Dollar Didn’t. Here’s Why
- Jobs Beat, Ceasefire, Deficit: What It Means for Gold
- Gold Price Outlook: Oil Futures Disagree With Stock Markets
- Why Silver Hit $82 Today: Iran, Oil, and the Fed
- Gold Hits $4,746 as Oil Crashes — Why That’s Bullish
- Gold Price and Nonfarm Payrolls: Why the Fed Is Trapped
Popular Topics
Picked from the archive
-
01
 Topics
Gold’s Bull Run: Fed Rate Cuts and China Buying Drive $5K Target
-
02
Topics
Oil Price Tops $100 as OPEC Fractures – Gold Price Reacts
-
03
Topics
Why Trump Cannot Fire Federal Reserve Chair Jerome Powell
-
04
Topics
Insurance vs Upside: How Gold and Silver Balance Your Portfolio
-
05
Topics
Bank Safety Deposit Box vs Gold Vault: Which Is Safer for Gold?
-
06
Topics
Central Banks Slow Pace but Still Buy Gold as Demand Jumps 3%
-
07
Topics
Gold Bars vs Jewelry: Why Investors Choose Bullion
-
08
Topics
Gold Price Tops $3,800 as U.S. Shutdown Looms