
Silver closed near $79 on Wednesday, rising more than 3% and outpacing gold for the second consecutive day. The most important metric, however, is not the silver price itself but the gold/silver ratio.
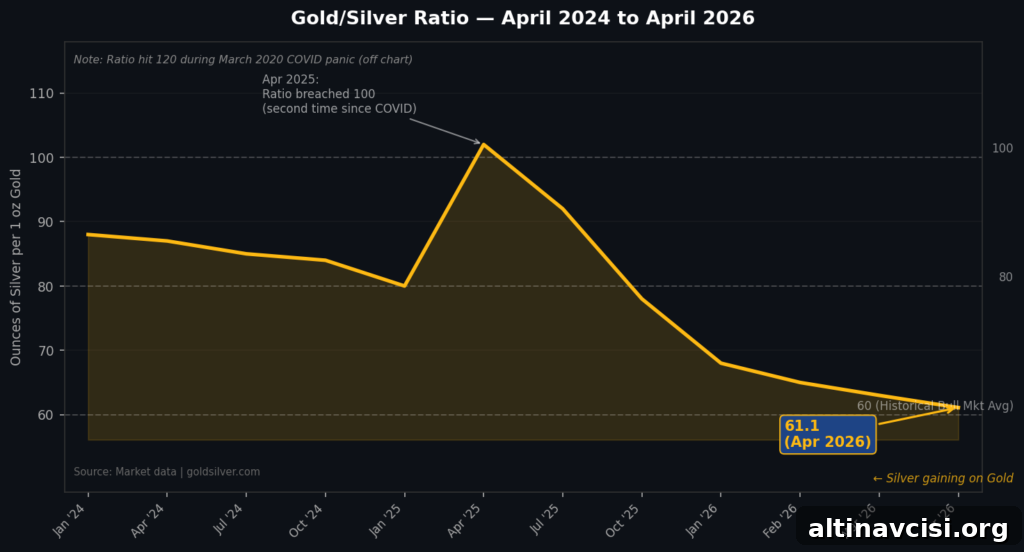
The gold/silver ratio has compressed to 61.1. For serious precious-metals followers, that figure matters: it indicates silver is gaining relative strength versus gold, suggests the broader bull market may be moving into a new phase, and supports the case that structural drivers for silver are finally emerging.
What is the gold/silver ratio — and what does 61.1 actually mean?
The gold/silver ratio shows how many ounces of silver are required to buy one ounce of gold. At 61.1, the ratio is meaningfully lower than recent extremes — for example, it reached about 120 during the March 2020 market panic and climbed above 100 again in April 2025.
Historically, sustained precious-metals bull markets see the ratio average in the 50–60 range. When the ratio falls toward that historical band, it typically signals that silver is catching up to gold and that more structurally driven forces are taking hold.
Silver typically lags early in a precious-metals rally, then catches up and sometimes overshoots. A reading near 61.1 suggests that catch-up phase is now underway.
What’s driving silver right now?
The near-term catalyst has been an easing of tensions in the Middle East. A de-escalation around the Strait of Hormuz eased oil-market stress, bringing oil back below $90 and sending the dollar to a six-week low. A weaker dollar and lower inflationary pressure tend to push investors toward precious metals, and silver benefits from both forces.
But geopolitical calm is only part of the story.
The Edge Every Investor Needs
Smarter precious-metals investing starts with up-to-date market insights, policy developments, global trends, and practical education.
Why has silver been in supply deficit for six straight years?
The Silver Institute has documented a persistent market reality: six consecutive years of supply deficits. Global demand has consistently outpaced mine production, and the shortfall has been met by drawing down above-ground inventories — a finite source that cannot be sustained indefinitely.
On the demand side, structural factors are intensifying. Data centers and high-performance computing use more silver per server than older hardware because silver-coated components improve thermal management and conductivity. Electric vehicles also require substantially more silver per vehicle than internal combustion models, and EV adoption continues to rise.
This growing industrial demand creates a reliable floor under silver’s price that is independent of short-term policy moves, geopolitical events, or day-to-day fluctuations in gold.
What does stagflation mean for precious metals — and are we already in it?
The IMF’s April World Economic Outlook revised 2026 global growth down to 3.1% while raising inflation to 4.4% — a combination of slowing growth and higher prices consistent with stagflation.
Stagflation is an environment where traditional savings and investment assets struggle simultaneously: bonds can lose purchasing power, stocks face earnings pressure, and cash yields trails inflation. During the 1970s stagflationary decade, gold climbed more than 700% as investors sought protection from monetary debasement.
Central-bank behavior reinforces this dynamic. Through March, the People’s Bank of China added to its gold holdings for the 17th consecutive month, and wholesale withdrawals from the Shanghai Gold Exchange rose sharply. These actions signal a continued shift away from dollar-denominated assets and reflect central banks’ preference for tangible stores of value.
Central-bank buying provides a structural bid beneath gold, and individual investors can interpret that behavior as informative when building diversified portfolios.
Is gold’s rally sustainable above $4,800?
Gold closed near $4,826 on April 15, holding firmly above $4,800. That level is roughly 44% higher than pre-conflict prices, even after a roughly 16% pullback from January highs near $5,594. The key takeaway is resilience: despite some unwinding of a war premium, gold has not collapsed.
A persistent structural bid from central banks, ETFs, and private savers supports the market floor. The compression of the gold/silver ratio to 61.1 is evidence market participants are beginning to view silver as the undervalued counterpart in the traditional “sound money” pair.
How far can the ratio compress from here?
At 61.1 the ratio sits near its long-term bull-market average but has not yet reached the sub-50 territory seen during the most aggressive silver rallies. The structural case for further compression remains: persistent supply deficits, rising industrial demand, and ongoing monetary pressures.
When ratio compression gains momentum, history shows it often extends beyond initial expectations. With central banks and policymakers balancing between slowing growth and elevated inflation, that tension is unlikely to resolve quickly, which can prolong the environment favorable to precious metals.
For now, gold remains supported above $4,800 and silver is showing accelerating strength — a dynamic that has driven months of gradual ratio compression.
SOURCES
1. International Monetary Fund — World Economic Outlook, April 2026
2. International Monetary Fund — Press Briefing Transcript, World Economic Outlook Spring Meetings 2026
3. World Gold Council — China Gold Market Update: March 2026 seasonal demand rebound
4. Silver Institute — Global Silver Investment commentary on multi-year market deficits
By the GoldSilver Editorial Team — helping investors understand sound money since 2005. This article is informational only and is not financial, investment, or tax advice. Consult a qualified financial advisor before making investment decisions.
You May Also Like
- Silver Holds Near $80 as Iran Ceasefire Revives Rate-Cut Bets
- The Fed Goes Silent in 3 Days – What Does That Mean For Gold?
- Gold Is Down 10% From Its War-Peak — and Still Up 46% in a Year
- Gold Outranks the Dollar at Central Banks — What It Means for Your Savings
- Hormuz Blockade Sent Gold Down 2%. Here’s Why That’s Bullish
- Gold Jumps 2% as Trump Plans Iran War Address Tonight
- $88 Billion a Month: Why U.S. Debt Is Driving Gold Prices