Gold Price Falls Below 50-Day Moving Average
Gold Prices Pull Back toward 50-Day Moving Average as Dollar Strengthens
Spot gold extended a short-term pullback on Friday, testing the $3,341.10 level, which corresponds to its 50-day moving average. The metal slipped after falling below a nearby short-term pivot at $3,347.97, prompting traders to reassess positions amid changing market dynamics.
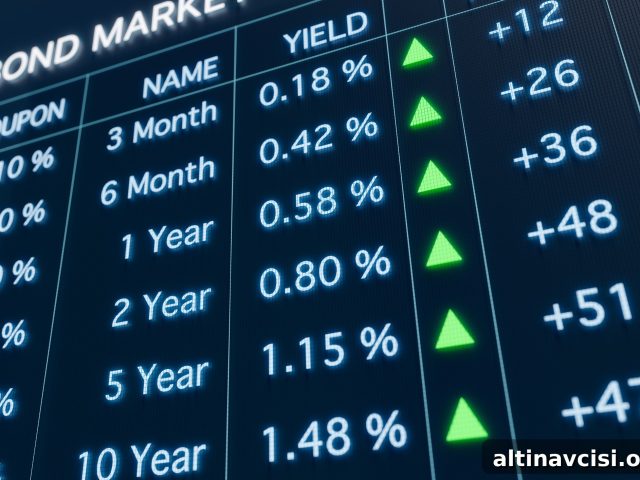
Several factors have contributed to the recent weakness in bullion. A firmer U.S. dollar and rising Treasury yields have diminished some of gold’s appeal, while renewed confidence in risk assets has encouraged investors to reduce safe-haven allocations. As a result, demand for physical and paper gold has softened, weighing on prices around the key moving-average support.
From a technical standpoint, the 50-day moving average at $3,341.10 is a closely watched support level. Technical indicators suggest that if gold is unable to hold above this line, the next meaningful downside target could be around $3,310.48. That level would represent a deeper retracement and may act as the next support zone where buyers could emerge. Conversely, a recovery back above the short-term pivot at $3,347.97 would likely stabilize the price action and could signal a renewed attempt to reclaim recent highs.
Market participants are monitoring momentum and trend indicators to gauge the likelihood of either outcome. Momentum oscillators and moving-average crossovers can offer early clues about trend shifts, while volume and open interest in futures markets help confirm the conviction behind moves. Because gold often reacts to macroeconomic developments, traders also pay close attention to shifts in interest-rate expectations, currency valuations, and overall risk sentiment.
The interplay between the U.S. dollar and Treasury yields remains especially important for gold. A stronger dollar tends to make dollar-denominated commodities like gold more expensive for holders of other currencies, reducing demand. Rising Treasury yields increase the opportunity cost of holding non-yielding assets such as gold, which can further pressure prices when yields climb. When yields ease or the dollar weakens, gold typically finds more support as the relative attractiveness of bullion improves.
Investor behavior has reflected these dynamics. With confidence in riskier assets returning, some investors have trimmed exposures to bullion, reallocating capital into equities or other yield-bearing instruments. Positioning in exchange-traded funds and futures markets can shift quickly, and that flow can amplify short-term price movements. Traders often look for clean break-and-hold patterns on daily or weekly charts before committing to larger directional trades.
Looking ahead, market catalysts that could influence whether gold holds the 50-day moving average include economic data releases, central bank communications, and changes in global risk appetite. Any surprise that affects interest-rate expectations or inflation outlooks could alter the technical picture. Until the market produces a clear directional signal—either a sustained break below $3,341.10 toward $3,310.48 or a rebound above $3,347.97—traders are likely to exercise caution and watch these key thresholds closely.
In summary, gold’s current retracement toward the 50-day moving average reflects a combination of a stronger dollar, higher Treasury yields, and improved risk sentiment. Technical indicators now highlight $3,341.10 as an important support, with $3,310.48 representing a potential next downside target if that support fails. A recovery above $3,347.97 would help stabilize prices and could pave the way for renewed upside momentum.
Popular Topics
Picked from the archive
-
01
 Topics
Gold Drops to One-Month Low as Geopolitical Risks Ease
-
02
Topics
US Presses Allies to Cut China from Supply Chains by July
-
03
Topics
Moody’s Warning Rocks Bond Market, Investors Turn to Gold
-
04
Topics
Investors Doubt U.S. Bond Market: What It Means for Yields
-
05
Topics
Tariffs vs Treasuries: What’s Driving Gold Prices Now
-
06
Topics
Trump to Impose Tariffs on Trade Partners Without Negotiations
-
07
Topics
Tariffs Drive Gold Premium Over $100 Between New York and London
-
08
Topics
CBO: GOP Tax Plan Adds $3.3T to Federal Deficit in 10 Years