Fed Decision Is Priced In: Five Risks Investors Are Missing

Gold is trading near $4,298 and silver around $63.67 on Tuesday afternoon [CME] as the Federal Reserve wraps up a two-day policy meeting. With markets already pricing in an 85–90% chance of a rate increase [CME FedWatch], the rate decision itself is unlikely to be the largest market-moving item. Instead, the key drivers beneath the surface include: how speculators repositioned ahead of the meeting, why the Fed’s dot plot and projections carry more weight than the headline vote, which buyers official data may miss, the renewed role of oil in inflation dynamics, and an approaching seasonal lift in physical gold demand.
Did Speculators Really De-Risk Gold Ahead of the Fed?
Not on the broad measure. Commodity Futures Trading Commission (CFTC) data for the week ending September 8, 2026 (published September 11) show legacy non-commercial traders remained net long 231,960 gold contracts, a weekly increase of 3,836 contracts. That means speculative exposure actually became more one-sided heading into the meeting, not less. A narrower category — managed-money, which isolates hedge funds and CTAs — did trim its net long position to 134,972 contracts, down 1,799 on the week. Both readings describe the same market from different perspectives, and neither indicates a large, crowded unwind. The net effect: a sizable, largely intact speculative long is approaching a binary policy outcome, which raises the potential for a pronounced price move once the decision and accompanying projections are released.

The Edge Every Investor Needs
Smarter precious metals investing starts here. The Nuggets Newsletter delivers concise market insights, Fed updates, global trends, and practical education for investors.
Why Does the Dot Plot Matter More Than the Rate Decision?
Because the market has largely priced in the near-term hike, the headline vote provides limited new information. The Summary of Economic Projections (the dot plot) released with the decision is where fresh guidance appears: it reveals how many policymakers expect further increases, the distribution of those views across the committee, and whether the chair includes a rate projection. A hawkish set of projections — more officials penciling in additional hikes — raises expected real yields and puts pressure on gold. Conversely, a split committee or an omission of a projection tends to ease those expectations and can support gold prices. In short, traders are watching the dots and the committee split for the policy signal that will likely shape market expectations beyond the immediate announcement.
Who Is Actually Buying the Gold Official Data Doesn’t Show?
Official numbers can understate central-bank and sovereign demand. Recent research suggests central-bank buying accelerated significantly in mid-2026: a nowcast model indicated monthly purchases reached about 100 tonnes on a three-month, seasonally adjusted basis in June, up from 66 tonnes previously. China appears to be a notable example; model estimates suggest purchases routed through London’s over-the-counter market were substantially larger than the figures Beijing publicly reported for the same period. The discrepancy likely stems from differences in reporting practices and timing — governments disclose reserve additions selectively and on their own schedules. If these larger hidden flows persist, official-sector demand forms a steadier floor under gold than the headline reserve numbers imply, offering structural support even if short-term market sentiment shifts after the Fed announcement.
Why Is Oil Back in the Inflation Argument This Week?
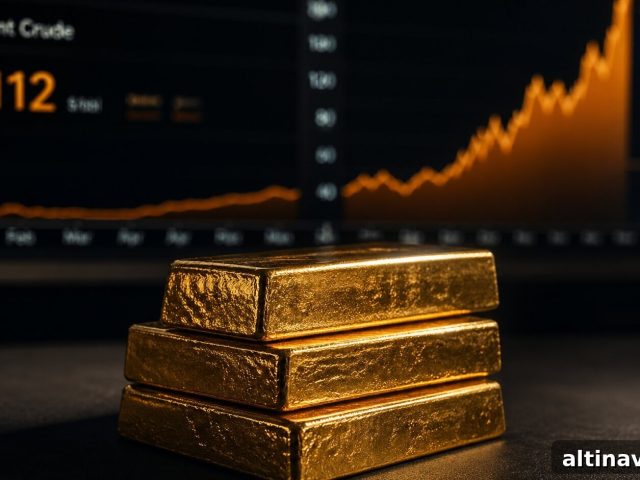
Recent supply disruptions have kept oil prices elevated, and energy costs feed directly into the inflation measures the Fed monitors. Pipeline outages and ongoing geopolitical uncertainty in energy-producing regions contribute to higher crude prices, which can translate into firmer headline inflation. That dynamic increases the probability that the Fed takes a hawkish stance at the meeting, and it helps explain why gold has held near $4,300 instead of collapsing on bets of an imminent rate path change. However, energy-driven inflation differs from demand-driven inflation: monetary policy can temper demand but cannot restore physical oil flows overnight. That nuance affects how persistent this inflation pressure might be after the Fed decision.
Is Physical Gold Demand About to Get a Seasonal Boost?
Yes. Seasonal restocking ahead of the fourth-quarter buying season typically lifts physical demand, and recent updates point to rising activity in China’s retail market. Trading volumes on Shanghai’s gold futures contract increased notably month-over-month in August, reflecting stronger physical-market participation. Retailers set inventory orders months in advance, so restocking plans are already influencing demand irrespective of short-term policy shocks. That means a Fed announcement can shift displayed prices today, but it does not change the underlying inventory purchases that feed the seasonal uplift in physical demand into the year-end period.
Stay On Top of Gold & Silver Prices
Get important market alerts sent straight to your inbox.
SOURCES
1. CFTC — Commitments of Traders, Legacy and Disaggregated Futures-Only Reports, positions as of September 8, 2026 (published September 11, 2026).
2. CME Group — FedWatch Tool, rate-hike probability tracking.
3. Britannica Money — “Fed Dot Plot: Interpreting the FOMC’s Summary of Economic Projections.”
4. StoneX Market Intelligence — Fed meeting preview, dot-plot commentary.
5. Goldman Sachs Research — central-bank gold nowcast, June 2026 update.
6. TradingEconomics — commodity desk notes and market commentary.
7. World Gold Council — China gold market update and monthly market summaries.
Disclaimer: This article is for informational purposes only and does not constitute investment advice. Past performance is not indicative of future results. Always consult a qualified financial adviser before making investment decisions.
You May Also Like:
- The 10-Year Yield Just Hit an 18-Year High. Gold Isn’t Falling For It.
- Gold Fell 1.62% Today. Gold Miners Didn’t. Here’s the Math.
- Gold Fell to $4,271 Today. Five Bigger Stories Are Moving Underneath It.
- Gold Just Ignored a War. Here’s What It’s Actually Watching.
- Five Things Are Moving Gold and Silver Today. They All Point to the Same Argument.
- Gold and Silver Price Today: Why They Just Reversed.
Popular Topics
Picked from the archive
-
01
 Topics
How the Fed Picks Gold Market Winners
-
02
Topics
Silver Price Outlook Sep 2026: Hike Priced In, Positioning Lags
-
03
Topics
Gold Price Outlook June 2026: CPI Impact and Fed Signals
-
04
Topics
Why One Central Bank Sold Gold and Why Most Haven’t
-
05
Topics
Record Gold ETF Outflow Sparks Debate as China Disagrees
-
06
Topics
Why Gold Surges When the Strait of Hormuz Opens and Then Falls
-
07
Topics
Seigniorage: How Inflation Acts as a Hidden Tax on Your Dollars
-
08
Topics
Gold Price Falls Before US Market Opens