
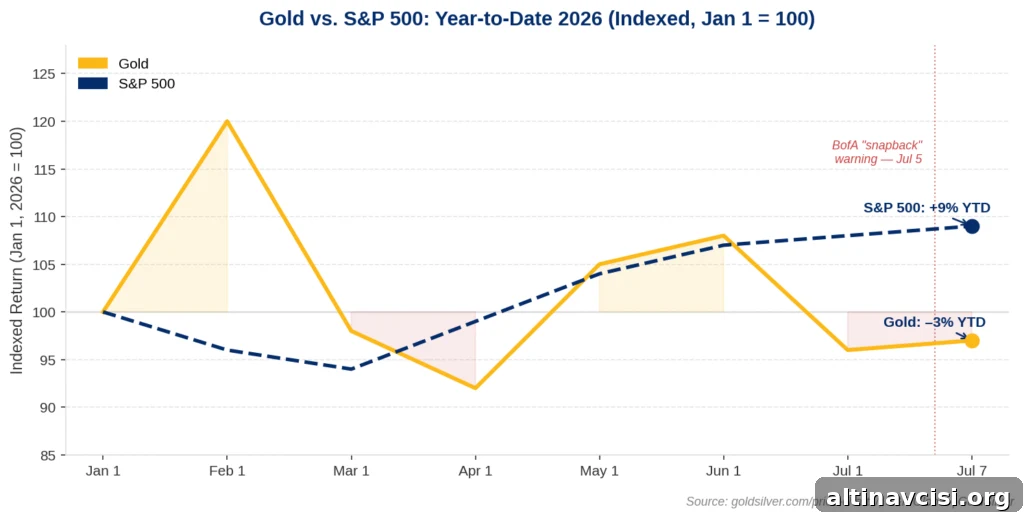
Bank of America has flagged current U.S. equity speculation as reaching levels not seen since 1999–2000 — the period just before gold embarked on its longest modern bull market. As of early July 2026, gold was trading near $4,160 and was down roughly 3% year-to-date, while the S&P 500 had risen about 9%. That divergence is not accidental; it helps explain the market dynamics under discussion.
What BofA Said
On July 5, 2026, Bank of America strategist Savita Subramanian reiterated a year-end S&P 500 target near 7,100, approximately 5% below prevailing levels at the time. The note was explicit: speculation, particularly in high-multiple stocks, is reaching extremes that historically precede valuation snapbacks. The bank has spent much of 2026 warning that the S&P was trading above levels justified by current earnings.
Their comparison to 1999–2000 is specific rather than rhetorical. No post-1999 rate-hike cycle began with U.S. stocks as expensive as they are now, the bank noted. That historical parallel highlights the risk that a concentrated speculative rally can unwind, especially when capital flows are narrowly focused on a handful of high-valuation names.
The AI-driven rally has concentrated returns unevenly. Examples from 2026 include outsized gains in semiconductor and AI-related names, and large public offerings that attracted substantial demand. That concentration increases the odds that gains remain lopsided rather than broad-based. Bank of America’s view is that the concentration will likely correct rather than continue to expand indefinitely.
The 1999 Parallel Gold Investors Should Know
The historical comparison points to a familiar sequence. In August 1999, gold traded near a generational low while technology stocks were in a mania. Central banks were reducing holdings, and sentiment toward gold was widely negative. As the Nasdaq peaked in March 2000 and the tech unwind began, gold had already been forming a base around its low and then started a sustained advance that lasted more than a decade.
Between roughly 2001 and 2011, gold climbed from the low hundreds to nearly $1,921 per ounce, a multi-year, multi-cycle rise that unfolded through recessions, a banking crisis, and extended accommodative monetary policy. The core mechanism was simple: as prices for earnings-dependent assets compressed, capital moved toward assets that do not rely on earnings, including gold.
Gold’s appeal in those periods stems from its nature as a non-yielding store of value that operates outside corporate earnings and earnings multiples. It does not require technological innovation to justify demand; it offers a way to preserve purchasing power when confidence in financial assets weakens. That dynamic contributed to gold’s strong performance following the late-1990s equity peak.
While circumstances differ today, the basic mechanism that shifted capital into gold after the 1999–2000 peak remains relevant: extreme equity speculation can reverse, and when it does, capital often reallocates to assets viewed as reliable stores of value.

The Edge Every Investor Needs
Smarter precious-metals investing begins with timely insights, market context, and clear analysis to help you make informed decisions.
Why Gold Is Down While Stocks Are Up
The 2026 disconnect between gold and equities has an understandable explanation: real yields. When nominal interest rates rise faster than inflation expectations, assets that do not pay interest tend to face pressure. In June 2026 the Federal Reserve maintained a higher policy rate range, and that hawkish posture created headwinds for non-yielding assets.
Gold experienced a sharp monthly decline in June, the largest monthly fall since late 2008, reflecting that real-yield pressure. After weak jobs data in early July, some short-term rate-hike probabilities moved lower, which helped gold recover modestly. In the week ending July 3, gold posted its first weekly gain since late May.
Silver showed stronger short-term performance in that same week, narrowing the gold-to-silver ratio. Moves like that often reflect industrial demand expectations and can be constructive for holders of physical metals. The temporary weakness in gold has more to do with cyclical monetary-policy dynamics and speculative flows into AI-related equities than with any permanent break in gold’s structural case.
Put simply: gold’s short-term decline reflects real-yield dynamics and a rotation of speculative capital into high-growth equities, not a fundamental collapse of the reasons investors hold precious metals as a hedge or store of value.
What the Sound Money Lens Shows
Recent institutional commentary has been consistent: the Q2 selloff in precious metals primarily recalibrated entry prices rather than undermining the structural thesis. Broader fiscal and monetary dynamics remain in place. The U.S. government continues to run fiscal deficits and the national debt remains elevated. The Federal Reserve must balance fighting inflation with avoiding an abrupt economic slowdown. Those macro forces have not been resolved and can reassert influence over time.
When equity speculation reaches extremes similar to those of 1999, gold’s valuation relative to stocks tends to fall toward historical lows. In such environments, gold often looks cheapest precisely because few investors are seeking insurance. That is when opportunities for reallocation appear to long-term oriented investors.
Upcoming policy communications and central-bank minutes can sway short-term expectations for rate hikes and therefore influence precious-metals prices. A more hawkish reading of policy deliberations would likely add near-term pressure to gold, while a dovish interpretation could reopen upside potential for the metal.
The central question raised by Bank of America is worth considering: if U.S. equities are as expensive now as they were in 1999, and gold sits at relatively depressed levels versus equities, how might capital flows respond when speculation reverses? History offers one answer, and while history is not destiny, the underlying mechanism that pushed capital into non-earnings assets after the last extreme remains intact.
Stay On Top of Gold & Silver Prices
Receive market alerts and concise analysis delivered to your inbox.
SOURCES
1. Fortune — BofA stock market outlook and commentary, July 5, 2026.
2. CNBC — Coverage of gold and silver price moves and Fed rate expectations, early July 2026.
3. GoldSilver — Live gold and silver spot price information, July 2026.
4. Federal Reserve — FOMC calendars and the June 2026 Summary of Economic Projections.
5. Bureau of Labor Statistics — Employment situation summary, June 2026.
6. CME Group — Fed rate-probability tool (FedWatch), July 2026.
7. Trading Economics — Historical gold price data, July 2026.
8. CNBC — Reporting on gold’s monthly decline related to Fed policy, June 2026.
Disclaimer: This article is informational only and does not constitute financial or investment advice. Consult a qualified financial adviser before making investment decisions.
You May Also Like:
- Warsh Sat Out the Dot Plot. The FOMC Minutes Drop Wednesday.
- Gold Digest: Five Institutions Just Said the Same Thing About the Selloff.
- Gold Hits 3-Week High as Fed Hike Odds Halve on Jobs Miss.
- The Jobs Report Missed. The Unemployment Rate Fell Anyway. Gold Didn’t Buy It.
- Gold Jumps 2.5%, Silver Surges 3.85% as Rate-Hike Bets Unwind Ahead of Jobs Report.
- Warsh Called Inflation “Too High.” He Also Said the Risk Is Fading. Gold Noticed.