Bank Says Fed Will Continue Rate Hikes: What It Means for Gold
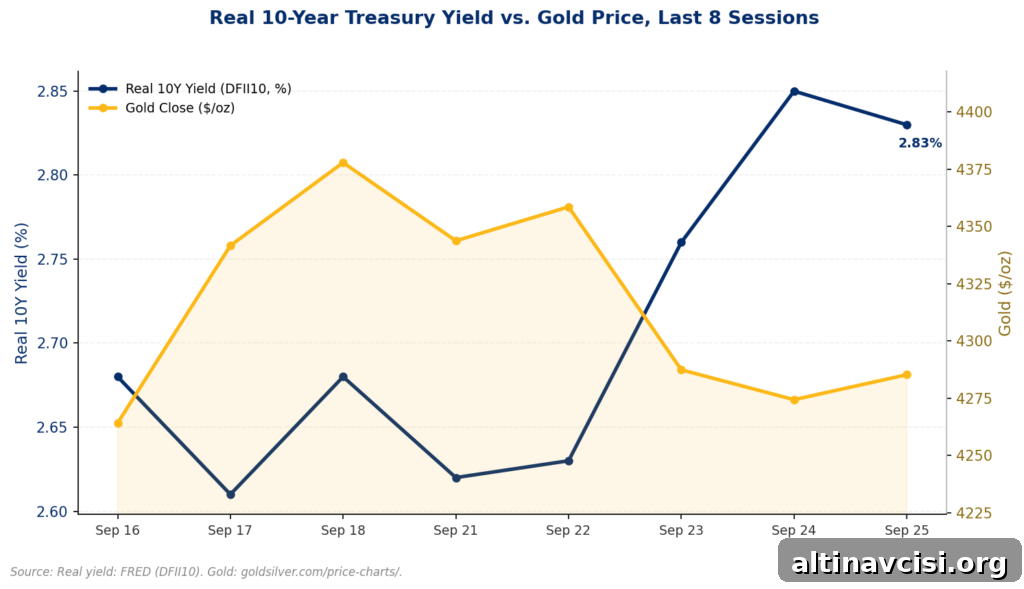
A Nomura strategist told Bloomberg that the US economy may be able to absorb more Federal Reserve rate hikes than markets currently expect. That statement is not an official Fed announcement; it is a forward-looking judgement about where real interest rates might go next. For gold investors, real yields are the most reliable driver of price moves. This week demonstrated that link: the real 10-year Treasury yield rose from 2.62% to 2.83% over four trading sessions, and that kind of move matters to gold’s near-term ceiling.
Below I explain what these shifts mean for gold’s price ceiling — and what they do not mean for the metal’s longer-term case.
Key Takeaways:
- Nomura’s North Asia chief investment officer told Bloomberg (Sept 28, 2026) that the US economy looks resilient enough to handle additional Fed hikes without tipping into recession, pointing to consumer spending, AI-related capital investment, and accommodative fiscal policy.
- The real 10-year Treasury yield rose from 2.62% to 2.83% between September 21 and 25, 2026. If the Fed’s tightening cycle extends, real yields are likely to rise further.
- CFTC positioning data for the week ending September 22, 2026 showed COMEX gold speculative longs comprised roughly 61.5% of open interest. Heavy long positioning can amplify a price pullback after a hawkish surprise.
- Major banks’ year-end targets remain well above spot: Goldman Sachs at $4,900 and J.P. Morgan near $6,000, both above the then-current spot price around $4,165.
- A hawkish Fed is a meaningful near-term headwind for gold through rising real yields, but it does not negate the broader multi-year structural reasons investors hold the metal.
Why the Bank Call Matters More Than the Headline
The Nomura comment is a house view on how many more hikes the Fed could deliver. That view matters for gold not because of the headline itself, but because it signals expectations for the path of real interest rates. Real yields are the single most consistent mechanism that moves gold’s price: when real yields rise, gold tends to fall; when they fall, gold tends to rally.
This article does not take a position on whether Nomura is right. Instead it outlines what a longer hiking cycle would likely do to gold’s short-term price ceiling if real yields continue to trend higher. Even if that scenario plays out, it does not erase the longer-term reasons many investors own gold.
What Is a Real Yield, and Why Gold Cares
Gold generates no coupon or dividend. Hold an ounce today and you still hold an ounce a decade from now. That means the relevant comparison for an investor is gold versus a long-term, inflation-adjusted safe return — typically the 10-year Treasury yield after inflation, or the “real yield.” Markets trade this through TIPS (Treasury Inflation-Protected Securities), and that is the rate that competes directly with non-yield-bearing assets like gold.
Between September 21 and 25, 2026 the real 10-year yield moved 21 basis points higher. Historically, a roughly quarter-point change in real yields has corresponded to a move of about $40 to $60 per ounce in gold, in the opposite direction. In other words: real yields up, gold down, all else equal.
Most coverage emphasizes the Fed meeting, the dot plot and the press conference — and those events matter. But the price action that moves gold is what real yields do in the days and weeks that follow. If Nomura’s thesis holds and the Fed can indeed raise rates further, the more probable outcome is a gradual grinding higher in real yields rather than a quick top. That directional pressure, not a single daily print, is what affects gold.
Is Gold’s Long Positioning a Risk Right Now?
A second factor rarely highlighted in rate stories is who already owns gold and how concentrated those positions are. The CFTC Commitment of Traders report for the week ending September 22, 2026 showed managed-money traders holding roughly 254,000 long contracts versus about 28,000 short — about 61.5% of open interest on the long side. That represents a one-sided speculative book.
A heavy long tilt isn’t inherently bearish; it reflects conviction built over a bull run. But crowded long positions leave the market more vulnerable to faster, sharper corrections if news turns hawkish. If the Fed tightens further and real yields keep rising, leveraged or speculative longs can be forced to sell quickly, magnifying a pullback beyond what the fundamental macro shift alone would cause. Expect more volatility around upcoming Fed-related data points, though this alone doesn’t imply a reversal of the multi-year uptrend.
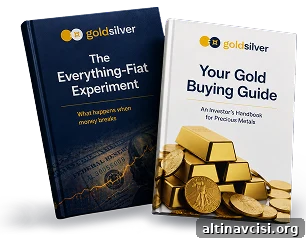
The Knowledge That Changes Everything
Two essential guides — free: why gold matters and why fiat currencies historically lose value. To request these guides, use the contact method on this site.
What the Street’s Own Money Says
If banks arguing for a longer hiking cycle were simultaneously turning bearish on gold, that would change the story. They are not. Major banks still publish year-end targets materially above spot. Goldman Sachs’ target is $4,900 and J.P. Morgan’s estimate is near $6,000; several other large institutions publish targets above the then-current price. These forecasts are driven by central bank purchases, ongoing reallocation by institutional and pension portfolios that remain underallocated to gold, and other structural factors supporting demand.
Those two views — a bank economics desk forecasting higher rates in the near term and a commodities desk projecting multi-year upside for gold — are compatible. One concerns the mechanics of interest rates over the next few months; the other addresses a longer-term capital reallocation into a metal that many large pools of capital still hold at low weightings. A hawkish period can slow short-term gains without reversing the multi-year narrative.
The Debt-Service Argument Not Made by Nomura
A related public argument focuses on the government’s fiscal position. Long-term Treasury yields at current levels were last common two decades ago, when federal debt was a much smaller share of the economy. US federal debt crossed $40 trillion in August 2026, meaning every percentage point increase in borrowing costs imposes a larger absolute cost on the budget today. This “debt-service” concern is distinct from the question of whether consumers and businesses can absorb higher rates. An economy may remain resilient while government finances become more strained as borrowing costs rise, and that structural tension is important for investors to watch over the medium term.
Takeaway for Gold Investors
You do not need to choose a side in the debate over how many additional Fed hikes will come. Instead, understand the mechanism: a longer hiking cycle tends to push real yields higher, which is a mechanical headwind for gold because the metal pays no yield. Heavy speculative longs can make that headwind play out as a faster, sharper correction. But these near-term dynamics do not negate the structural case that supports higher gold allocations over multiple years — the same forces underpinning bank price targets above spot.
Practical steps for investors: own some gold if it fits your allocation, pay attention to real yield movements and positioning data, and separate short-term rate mechanics from long-term structural reallocations. Understanding why prices move helps you respond rather than react.
People Also Asked
What did Nomura say about the Fed and interest rates?
Nomura’s North Asia CIO said on September 28, 2026 that the US economy appears able to handle additional Fed rate hikes without entering recession, citing resilient consumer spending, AI-related capital expenditure, and supportive fiscal policy. This is a house view and not an official Fed statement.
Why do rising interest rates hurt gold prices?
Because gold offers no yield, the key competitor is the inflation-adjusted return on safe government bonds. When real yields rise, the opportunity cost of holding gold increases and prices tend to soften. When real yields fall, that cost diminishes and gold tends to firm.
What is a real yield?
A real yield is the return on a bond after subtracting expected inflation. The market trades this via TIPS. On September 25, 2026 the real 10-year yield was about 2.83%, up from 2.62 just a few trading days earlier.
Is gold overbought right now?
Positioning appears one-sided rather than necessarily overbought on price metrics. The CFTC report showed speculative longs making up roughly 61.5% of COMEX open interest for the week ending September 22, 2026. Crowded longs can exacerbate corrections if sentiment changes, but this alone doesn’t prove a long-term top.
What are Wall Street’s gold price targets for the end of 2026?
At the time of the most recent forecasts, Goldman Sachs targeted $4,900 and J.P. Morgan targeted roughly $6,000. Other major banks also published year-end targets above the then-current spot price. These are projections, not guarantees.
Does a hawkish Fed mean it’s a bad time to own gold?
A hawkish Fed creates a real short-term headwind through rising real yields, but it does not automatically invalidate the multi-year reasons to hold gold. Short-term price pain and long-term structural allocation decisions are distinct.
What is fiscal dominance and how does it relate?
Fiscal dominance is a situation where government debt-servicing costs constrain central bank policy. It differs from the question of whether households and businesses can tolerate higher rates. An economy can tolerate higher rates while government finances become more strained, and that potential conflict is important for longer-term risk assessment.
SOURCES
1. Bloomberg – Nomura’s Wang: US Can Absorb More Rate Hikes – September 28, 2026.
2. FRED – 10-Year Treasury Inflation-Indexed Security (DFII10) – data as of September 25, 2026.
3. CFTC – Commitment of Traders Report – Week Ending September 22, 2026.
4. GoldSilver – Round-up of major banks’ 2026 gold forecasts and market commentary (September 2026).
5. GoldSilver – Explainer on real yields versus nominal rates (September 25, 2026).
6. GoldSilver – Coverage of the US national debt reaching $40 trillion (August 2026).
7. GoldSilver – Price charts and historical data (September 2026).
Disclaimer: This article is informational only and does not constitute investment advice. Past performance is not indicative of future results. Consult a qualified financial advisor before making investment decisions.
You May Also Like:
- Gold Fell 23% This Year. One Number Explains Why.
- What Is the Debt-to-GDP Ratio, and What the US Number Tells You About Gold
- The World’s Last Zero-Rate Anchor Is Rising, and Gold Should Care
- What Is a FOMC Meeting? What the Fed Decides and How Gold Reacts
- Gold in Your Phone: How Much Gold Is in Electronics and What It Means for Demand
- Real Yields vs. Nominal Rates: The Number That Actually Moves Gold
- How to Read a Gold Spot Price Chart: The 4 Things That Actually Matter
- Central Banks Hold 80% of Reserves in Gold. Sovereign Wealth Funds Hold Under 1%.
Popular Topics
Picked from the archive
-
01
 Topics
Weaker Dollar, Falling Gold: A Bullish Signal
-
02
Topics
Gold Drops 22% Like 2022: Why the Floor Is Different
-
03
Topics
Municipal Bonds Reach 15-Year Record: Why Gold Is Unaffected
-
04
Topics
Gold, Silver Steady as Bessent Seeks Hormuz Deal; JOLTS Falls
-
05
Topics
Gold Prices Pull Back Ahead of Fed Meeting
-
06
Topics
Will Policy Reversal Move Gold? Conflict Pressure Index Insight
-
07
Topics
Gold Falls to Two-Month Low as Yields Rise, Not Iran
-
08
Topics
Silver Price Outlook Sep 2026: Hike Priced In, Positioning Lags