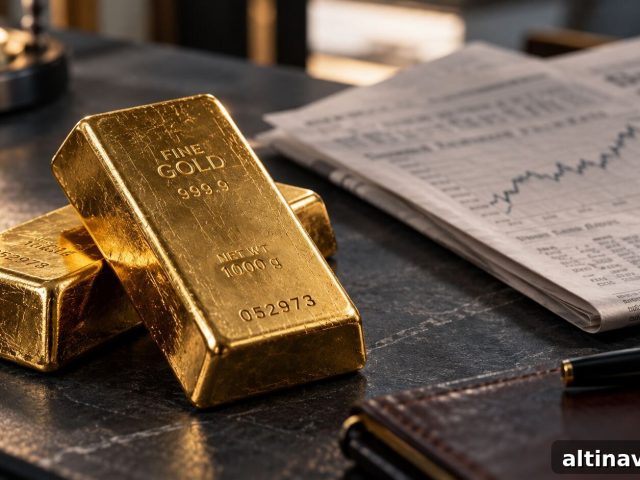
Gold Prices Pull Back Ahead of Fed Meeting
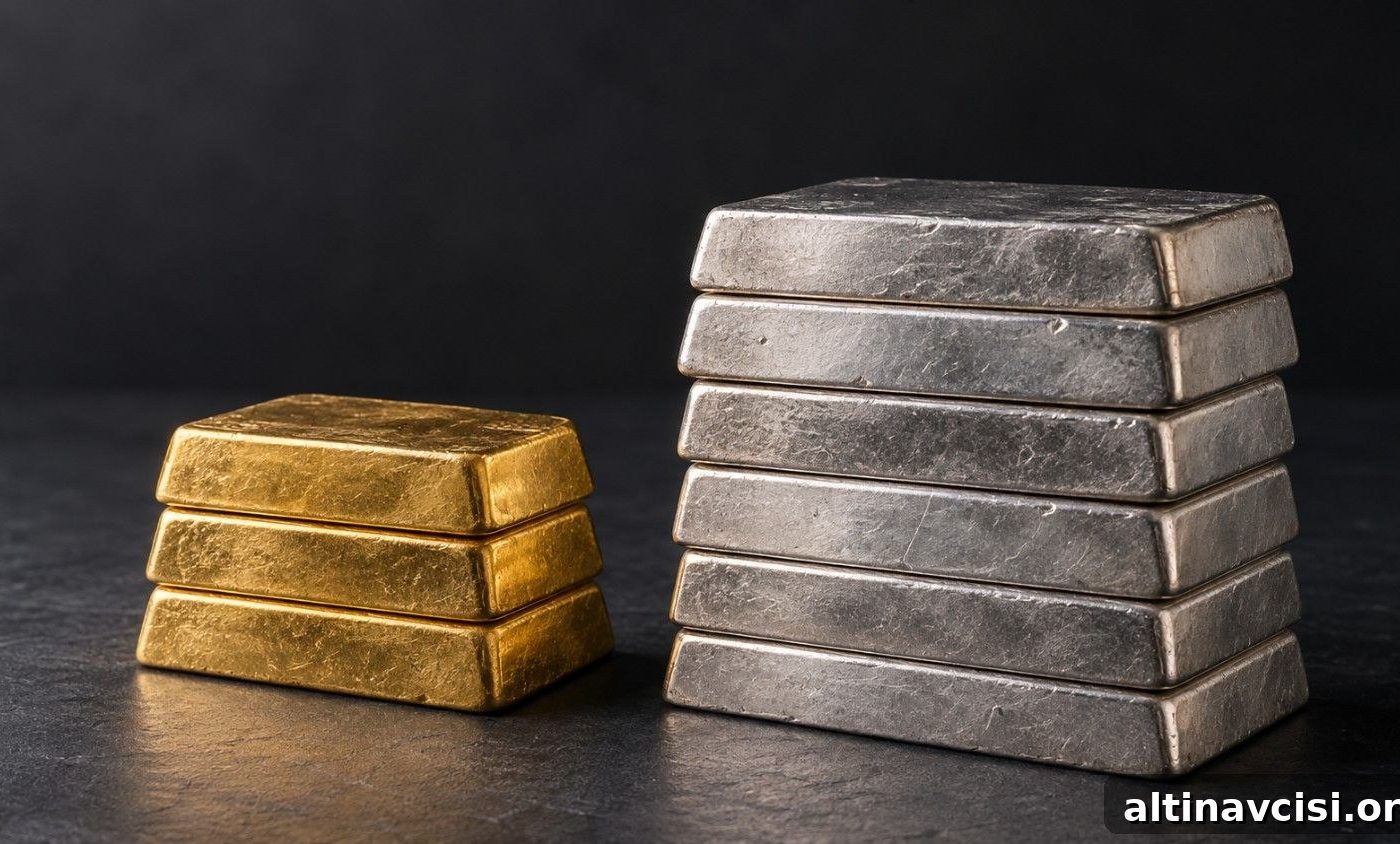
Gold has retraced roughly 3.4% since its October 9 close, while silver has fallen by nearly three times that amount. As markets now lean toward the Federal Reserve holding rates at its October 27–28 meeting, traders are asking whether this two-week pullback is an early warning of a trend reversal or simply the cost of admission after a very sharp run-up. Below is a clear, data-focused look at what has happened and what matters next for gold and silver.
Spot gold traded near $4,053 this morning, down from the October 9 close of $4,194. That 3.4% decline occurred over ten trading sessions and accelerated during the latest session, when gold opened near $4,141 and slipped to current levels within hours. Silver dropped more sharply, from $60.82 to $55.17, a 9.3% fall. Because silver fell faster, the gold–silver ratio widened from about 69:1 to roughly 73:1 — meaning it now takes more ounces of silver to buy one ounce of gold than it did two weeks ago. For investors who added silver on a “ratio compression” thesis earlier this year, that reversal is this month’s most important development, not gold’s headline move alone.
Key takeaways
- Gold fell about 3.4% from its October 9 close near $4,194 to roughly $4,053 as of this morning, with most of that move concentrated in the last week.
- Silver declined roughly 9.3% over the same period, pushing the gold–silver ratio from roughly 69:1 to about 73:1.
- Markets price the October 27–28 Fed meeting as most likely a hold; as of October 22, implied odds favored a hold around 86% and a hike around 12%.
- The federal funds rate has been at 3.75%–4.00% since the Fed’s September 16 decision.
- Central banks continued to buy gold aggressively in recent quarters, with a strong net purchase picture recorded through mid-2026.
Gold–silver ratio, 10 trading sessions ended October 22, 2026 (October 22 figure intraday). Source: CME Group.
Why did gold fall from its October highs?
The recent retreat looks more like a consolidation after a fast, concentrated rally than a structural reversal. Gold’s October 9 close at $4,194 followed a stretch of strong buying driven by central bank demand and a Fed viewed as hawkish but uncertain. After such a rapid advance, profit-taking is normal. What stands out this episode is the speed: most of the decline happened in the final week and a single session produced an intraday drop near 2%. Moves compressed into a short time frame often reflect position adjustments into a known event — here, the Fed meeting — rather than new information that alters the long-term case for the metal.
What does the Fed’s October 28 decision mean for gold?
The Federal Open Market Committee meets on October 27–28, with the statement and press conference scheduled for October 28. This scheduled meeting is not accompanied by updated economic projections, so the decision and the chair’s comments are the main near-term catalysts. As of October 22, markets priced a hold at 3.75%–4.00% as the most likely outcome. If the Fed holds, that outcome generally removes an immediate tightening surprise from the market and should stabilize real yields, supporting a pause in selling pressure on gold. Conversely, an unexpected rate hike would likely push real yields and the dollar higher, increasing short-term headwinds for gold and extending the recent pullback.
Is the gold–silver ratio widening a warning sign?
A widening gold–silver ratio is worth monitoring, but it is not an automatic alarm. The ratio measures how many ounces of silver purchase one ounce of gold; a rising ratio indicates silver underperformance. That is what has happened: silver dropped about 9.3% while gold declined about 3.4%. Silver’s larger industrial demand component makes it more sensitive to growth concerns, while gold responds more strongly to monetary and safe-haven dynamics. The ratio has swung sharply before in short periods, so this pattern can reflect normal rebalancing rather than a resolution of silver’s structural supply or demand issues. Use the ratio as one data point among many as investors watch economic signals and the Fed.
Are central banks still buying gold?
Yes. Recent official-sector data show continued strong central-bank demand. Mid‑year reports recorded substantial net purchases during the second quarter of 2026, reflecting ongoing reserve diversification. Revisions to earlier quarters have changed the annualized totals, but the core driver — official reserve diversification into gold — remains in place. That ongoing demand by official buyers provides a structural floor beneath prices, even if short-term market dynamics produce temporary pullbacks.
What are institutions forecasting for gold into year-end?
Institutional forecasts vary and have shifted in recent months. Some large banks adjusted their year‑end fair value estimates downward from earlier projections while still keeping multi-year targets materially above current prices. These moves suggest institutions view recent weakness as a near-term pause rather than a structural reversal, but they also underline the uncertainty that accompanies policy decisions and growth data. Treat dated forecasts with caution: they change as macro assumptions evolve.
Has the structural case for gold changed?
No. The longer-term drivers that support gold over a multi-year horizon remain intact: the relationship between real yields and gold prices, central-bank reserve diversification, and ongoing fiscal deficits that can pressure currency valuations. Short-term volatility does not erase these structural factors. A Fed hold will likely keep real yields near current levels; a surprise hike would test them further. Either outcome describes an environment in which gold and silver continue to play a role as monetary alternatives outside the banking system.
Stay on top of gold and silver prices
Receive concise market updates and alerts by email.
If you track precious metals, timely market context matters. Sign up for simple price and catalyst alerts from our editorial team.
[Subscription signup removed from this version]
People also ask
Through mid‑October, gold pulled back about 3.4% from its October 9 level, largely on profit-taking ahead of the Fed meeting. The structural demand case remains intact, and many market participants view the weakness as a short-term pause rather than a trend reversal.
Gold is driven more by monetary policy and safe-haven demand, while silver has a heavier industrial component. That makes silver more exposed to growth concerns, explaining its sharper decline relative to gold.
A hold would likely leave real yields roughly where they are, removing an immediate tightening surprise and helping stabilize gold prices in the near term.
An unexpected hike would likely push real yields and the dollar higher and could extend the short-term pullback in gold until those policy impacts are fully priced in.
Yes. Official-sector buying has continued into 2026, with notable net purchases recorded in recent quarters, supporting the structural demand picture for gold.
A ratio above 70 has historically indicated periods when silver traded cheaply relative to gold. It can be a useful signal for some investors but should be weighed alongside broader supply, demand, and macro data rather than taken as a standalone rule.
Sources
Federal Reserve — meeting calendars, statements, and minutes; CME Group — market pricing and the FedWatch tool; World Gold Council — gold demand trends and central bank activity; public institutional forecasts and market pricing data used for context.
Disclaimer: This article is for informational purposes only and does not constitute investment advice. Past performance is not indicative of future results. Consult a qualified financial advisor before making investment decisions.
You may also like
- Long-term gold ownership: the case for holding gold
- How higher silver prices can create cash-flow pressure for recyclers
- Why central banks have been large net buyers of gold in recent years
- Proof gold coins and the premium versus bullion value
- Why silver’s recent weakness was not solely driven by solar demand shifts
Popular Topics
Picked from the archive
-
01
 Topics
Gold Surges Past $4,130: What It Means for Investors
-
02
Topics
Why Gold Rallyed Despite Lower Jobless Claims: 4 Key Signals
-
03
Topics
U.S. Sanctions Target Iran’s Gold Sector, Prices Slide
-
04
Topics
Fed Printed 7 Trillion: Why Money Velocity Is Rising
-
05
Topics
Gold Market Split: Short-Term Sellers vs Long-Term Buyers
-
06
Topics
Gold Drops 19%: $3.8B Investor Bet Says It Won’t Matter
-
07
Topics
300 Billion Lesson: What Frozen Reserves Revealed About Gold
-
08
Topics
Which Gold Coins and Bars Are IRA Eligible