Gold Falls to 7-Week Low: What Charts Predict Next
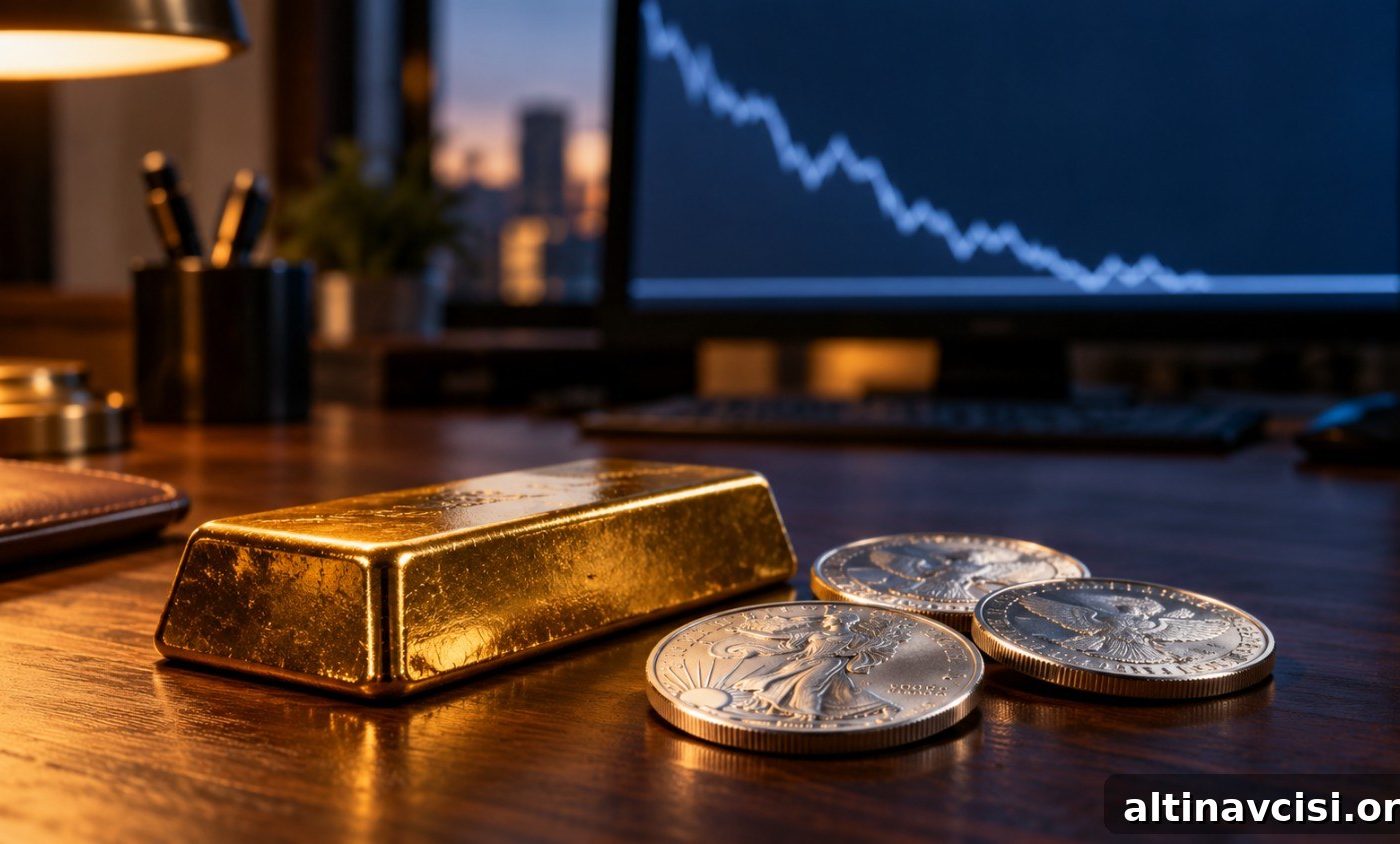
Gold traded at $4,136.27 an ounce this afternoon, down about 3.5% from the session open. Silver stood near $61.39, off roughly 4.5%. Both metals closed at their lowest levels since August 5, according to Reuters. The immediate market trigger was political: the rejection of Iran’s offer to reopen the Strait of Hormuz contributed to higher oil prices and tighter financial conditions. Rather than rehash the geopolitical story, this piece focuses on the technical question traders care about now: where do the charts suggest this drop could stop?
Gold & Silver: 10-Session Price Path vs. Key Levels
Daily close, Sept 15–28, 2026 — gold (left axis) vs. silver (right axis)
Over the past ten trading sessions, gold moved from the mid-$4,200s to the mid-$4,100s while silver fell from the low $60s to roughly $61. Key technical levels highlighted by multiple readings are: gold support roughly $4,050–$4,113 and gold resistance near $4,300; silver support clusters near $60–$61. Today’s intraday lows tested those support areas but did not decisively close below them. Traders should watch whether these zones hold into the close for clues about the next directional move.
Source: this desk’s spot-price history and intraday technical reads | GoldSilver
Where Is Gold’s Nearest Support Level?
Multiple independent technical indicators converge on a support band between roughly $4,050 and $4,100 per ounce. Today the market flagged $4,113 as the first meaningful line of defense after gold broke an earlier Fibonacci shelf near $4,230. That band aligns with a floor that developed earlier this month, visible on our live price charts. Importantly, gold has not closed below $4,100 since early August; a sustained close inside the $4,050–$4,100 range would therefore represent new multi-month territory rather than a routine pullback.
At present, the intraday decline has slowed just above $4,130 — about $30 above the top of that support band. That gap matters: a market that pauses above a well-watched level behaves differently than one that slices straight through it. If the price can hold here into the close, it increases the odds that the $4,050–$4,113 region will remain intact as the immediate floor.
Silver’s technical picture is tighter. Several live reads point to a clear floor around $60–$61, a cluster that combines round-number support and Fibonacci structure. Today’s low sat just above that zone, so silver is testing the floor rather than approaching it from a distance. Even though silver has fallen a larger percentage than gold in the session, its support area is better-defined and closer to the current price.
The Edge Every Investor Needs
Smarter precious metals investing starts here. The Nuggets Newsletter brings essential market insights, Fed updates, global trends, educational videos, and more.
What Would It Take for Gold to Reverse Higher?
The first major technical test on the upside is reclaiming $4,300. Gold last closed above that level on September 22, six sessions ago. The metal opened today near Friday’s close — around $4,285 — before the session’s sell-off wiped out roughly 3.5% in one day. For gold to mount a sustainable recovery, the underlying drivers that pushed it lower would likely need to reverse: oil prices easing, the market cutting back on Fed rate-hike odds, and real (inflation-adjusted) yields moving lower.
Those links are not theoretical. Our real-yield framework suggests that a 25-basis-point move in real yields often shifts gold by roughly $40–$60 per ounce. When real yields rise, a non-yielding asset like gold becomes relatively less attractive because inflation-adjusted bond returns improve. Today’s sequence illustrates those dynamics: a rejected Hormuz deal lifted oil, higher oil raised inflation expectations, inflation expectations increased Fed-hike probabilities (the market’s Fed odds climbed to roughly 70%), and higher expected policy tightness pushed real yields up — a chain that weighed on gold.
Why Is Silver Falling Faster Than Gold Today?
Silver moves more sharply than gold because it has a dual character: it is both a monetary and an industrial metal. Gold’s price action is dominated by monetary and store-of-value flows, while silver also responds to industrial demand. That combination gives silver added upside during economic expansions but also makes it more volatile when risk appetite falls. Today’s risk-off move pushed silver down harder than gold in percentage terms.
The gold-silver ratio, a measure of how many ounces of silver equal one ounce of gold, widened to about 67.4 today from the low 60s a week ago. That moves the ratio above a long-run reference point near 60 for this publication, though it is not yet at historically extreme levels. A continued widening could suggest further relative weakness in silver; conversely, a narrowing ratio would signal silver catching up to gold on the upside.
Three developments are worth watching over the coming days. First, whether both metals hold their identified support zones into today’s close. Second, Friday’s jobs report, which can shift inflation and rate expectations. Third, whether Brent crude remains above $100 per barrel — crude’s path will feed through inflation expectations and then into Fed-hike odds. The next scheduled Fed decision is in late October; each of these events will flow through the same real-yield channel that has driven recent moves.
SOURCES
1. Reuters (via USAGold Daily Silver Price History) — spot gold fell to its lowest since August 5; Fed hike odds ~70% (Sept. 28, 2026).
2. FXEmpire — market commentary on oil, yields and the dollar’s impact on gold and silver (Sept. 28, 2026).
3. FXStreet — technical notes on silver testing Fibonacci support near $61 (Sept. 28, 2026).
4. ActionForex — technical context for gold after a break of the $4,230 Fibonacci shelf (Sept. 28, 2026).
5. CNBC — oil-price coverage with Brent trading in the low-to-mid $100s per barrel (Sept. 28, 2026).
6. FOMC schedule — next meeting in late October 2026.
Disclaimer: This article is for informational purposes only and does not constitute investment advice. Past performance is not indicative of future results. Consult a qualified financial advisor before making investment decisions.
You May Also Like:
- Gold Sank 4% Today. Five Other Signals Point to a Steadier Market Underneath.
- Gold Fields’ $27 Billion Bid Got Rejected. The Reason Is a Risk Bullion Doesn’t Carry.
- Gold Falls 3% as Hormuz Standoff Lifts Fed Hike Odds to Mid-60s/70s.
- Sentiment Rose to 48.1. Gold Sold Off Anyway. The Number That Mattered Was 4.6%.
- Five Institutions Just Changed How You Can Own Gold and Silver.
Popular Topics
Picked from the archive
-
01
 Topics
Weaker Dollar, Falling Gold: A Bullish Signal
-
02
Topics
Gold Drops 22% Like 2022: Why the Floor Is Different
-
03
Topics
Municipal Bonds Reach 15-Year Record: Why Gold Is Unaffected
-
04
Topics
Gold, Silver Steady as Bessent Seeks Hormuz Deal; JOLTS Falls
-
05
Topics
Gold Prices Pull Back Ahead of Fed Meeting
-
06
Topics
Will Policy Reversal Move Gold? Conflict Pressure Index Insight
-
07
Topics
Gold Falls to Two-Month Low as Yields Rise, Not Iran
-
08
Topics
Silver Price Outlook Sep 2026: Hike Priced In, Positioning Lags