Gold, Silver Rally After Mixed CPI; CFTC Split Signals More
Last verified: September 11, 2026
Gold and silver both reversed earlier losses and rallied sharply after the latest Consumer Price Index release. Within minutes of the report, each metal jumped roughly 2%, wiping out days of declines. The move looked counterintuitive at first because the report was mixed: the headline CPI matched expectations while the Fed’s preferred core readings ran slightly hotter. Understanding why the metals rose requires looking at market expectations, positioning and the reaction of real yields.
Why Did Gold and Silver Jump After a Mixed CPI Report?
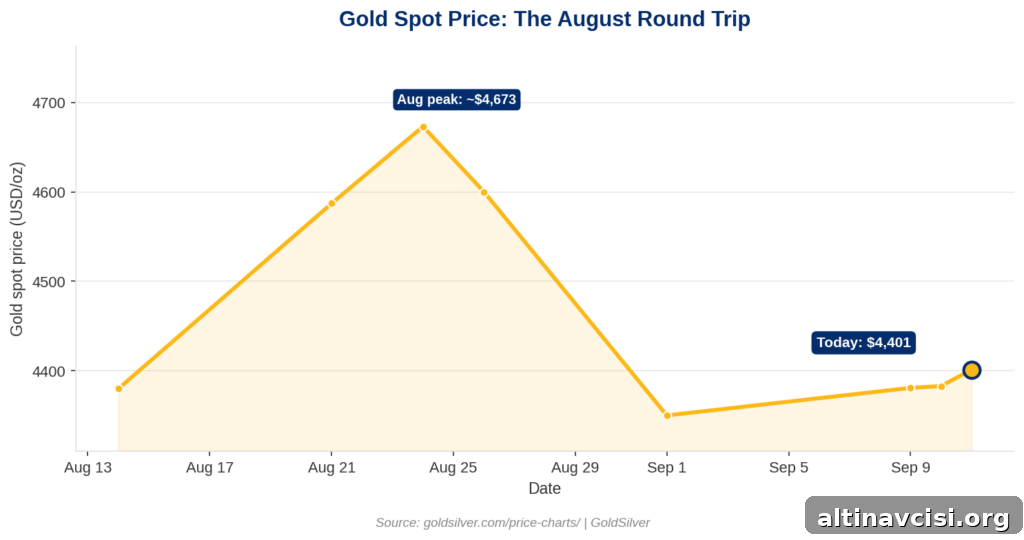
As of the report, spot gold traded near $4,401 per ounce and silver near $65.26. Headline CPI came in at 3.4% year-over-year, exactly in line with forecasts. Core CPI—a measure excluding food and energy that the Federal Reserve watches closely—increased 0.3% on the month versus a 0.2% consensus, while the annual core rate eased only to 2.4% from 2.5%.
On paper that reads as a mildly hot print, which ordinarily would be expected to push interest-rate expectations and real yields higher, pressuring precious metals. But markets had been bracing for an even worse surprise after a hot Producer Price Index reading and rising oil. Today’s CPI, while not soft, ruled out the more extreme outcome traders feared. That relief reduced the chance of an aggressive Fed tightening surprise and allowed real yields to fall slightly rather than spike higher. The result: a rapid relief rally in both gold and silver.
What Does the Positioning Split Actually Tell Us?
The market move matters, but positioning data suggest a more nuanced picture. Commitments of Traders (CFTC) data for the week ending September 1—before this week’s volatility—show speculators trimming their net-long gold positions by 15,210 contracts while adding 1,478 contracts to net-long silver. At that time both metals were weakening, yet traders split their convictions: many became more cautious on gold while others grew more confident on silver.
That divergence reflects different fundamental drivers. Silver has a meaningful industrial demand component—solar panels, electric vehicles and other industrial uses—which provides an independent support floor that doesn’t depend on central bank policy. Gold lacks that same industrial underpinning and is driven more directly by interest-rate expectations, real yields and safe-haven demand. The CFTC split therefore signals differing risk appetites and conviction levels across trader cohorts and may persist beyond any single data release.
Institutional price targets provide additional context. Major banks including Bank of America, JPMorgan and Goldman Sachs continue to carry 2026 gold price targets above the current level, and none trimmed those forecasts during this week’s volatility. That suggests analysts at large firms still expect higher prices over the remainder of the year despite short-term swings.
Zooming out, gold remains substantially higher than earlier in the year: roughly 9% above its August opening level and more than 90% higher year-over-year. A sharp two-day whipsaw around a single inflation print does not rewrite that multi-month performance or the longer-term case many investors make for holding physical metal outside the financial system.
What to Watch Next
The focus now shifts to the Federal Reserve’s September 15–16 meeting. A rate increase at that meeting would validate the near-term tightening risk that had weighed on speculative gold positioning prior to today’s rebound. A decision to hold, even if accompanied by hawkish language, would likely sustain the relief move. The next CFTC commitments report—covering positioning after this week’s price action—will show whether the recent split between gold and silver bets has persisted or reversed.
Key takeaways:
- Gold and silver each rallied roughly 2% after a mixed CPI release (headline in line, core slightly hotter), reversing much of the week’s earlier weakness.
- CFTC data week ending Sept. 1 showed speculators cutting net-long gold by 15,210 contracts while adding 1,478 contracts to silver, indicating a pre-existing split in conviction that predates this week’s rebound.
- Major banks still project 2026 gold targets above current levels, and the multi-month trend remains strongly positive for gold, despite near-term volatility tied to rate expectations.
- The Fed meeting on Sept. 15–16 is the next major catalyst; its decision will likely dictate whether the relief rally endures or gives way to renewed selling pressure.
SOURCES
1. GoldSilver — Gold & Silver Price Charts (Sept. 11, 2026).
2. U.S. Bureau of Labor Statistics — Consumer Price Index Summary (Sept. 11, 2026).
3. CFTC — Commitments of Traders Report (Week Ending Sept. 1, 2026).
4. GoldSilver — Gold Price Outlook September 2026 (Sept. 10, 2026).
5. GoldSilver — Gold and Silver Fall as Hot PPI Lifts Fed Rate-Hike Odds (Sept. 10, 2026).
Disclaimer: This article is for informational purposes only and does not constitute investment advice. Past performance is not indicative of future results. Always consult a qualified financial advisor before making investment decisions.
You May Also Like:
- Core Inflation Just Ran Hot. Gold and Silver Rallied Anyway.
- Gold and Silver Fall as Hot PPI Lifts Fed Rate-Hike Odds
- Five Signals Pointing the Same Way Into Next Week’s Fed Decision
- Silver Just Fell Three Times Harder Than Gold. Here’s the PPI Story Behind It.
- Gold’s Tiny Output Is Worth Twice Aluminum’s. Here Are Four More Signals Like It.
- Fed Hike Odds Went From 54% to 26% to 58%. Now It’s a Coin Flip.
Popular Topics
Picked from the archive
-
01
 Topics
What Investors Missed in Warsh’s Report When Gold Jumped $90
-
02
Topics
Why Gold Prices Are Falling Amid the Oil War
-
03
Topics
Silver Surges by a Third Over Gold Ahead of Fed Vote
-
04
Topics
China Moves Gold Reserves After 20-Month Buying Spree
-
05
Topics
Why Gold and Silver Are Rising: Five Reasons Experts Disagree
-
06
Topics
Why Silver Rose Despite JPMorgan’s Demand Warning
-
07
Topics
Why the IRS Requires a Depository for IRA Assets
-
08
Topics
Should You Still Hold Gold in Your Portfolio?