Core Inflation Surges While Gold and Silver Rally
Gold and silver moved against conventional expectations this morning. A hotter-than-forecast inflation reading and a stronger probability of Federal Reserve rate hikes would normally pressure precious metals, yet both gold and silver rose. Below I explain the factors behind that counterintuitive move and why the market remains uncertain ahead of next week’s Fed decision.
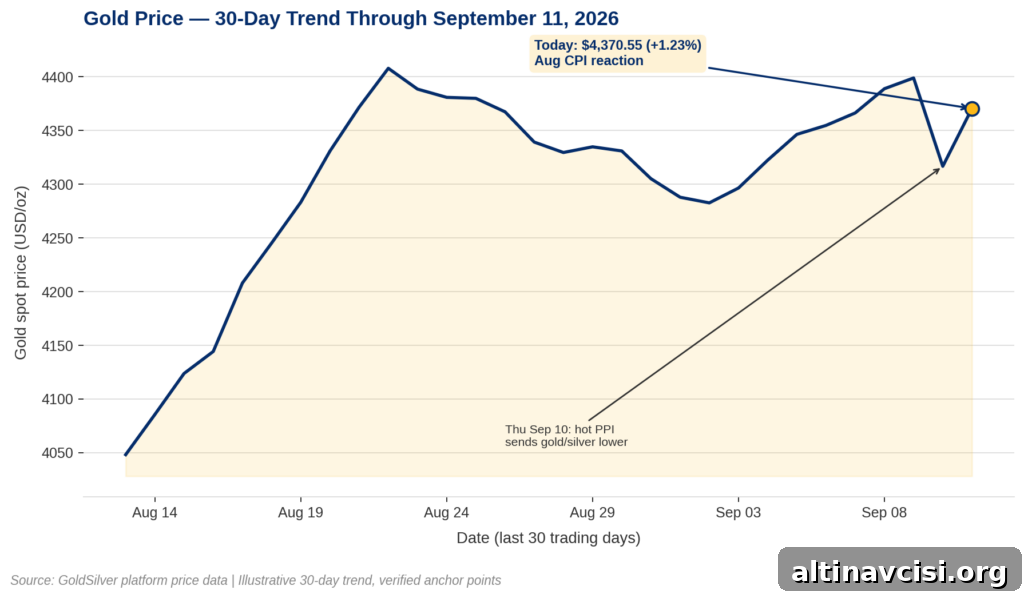
Why Did Gold and Silver Rise on a Hotter-Than-Forecast Inflation Report?
On September 11, 2026, both gold and silver rallied more than 1.5% by midday after the Bureau of Labor Statistics released the August Consumer Price Index (CPI) at 8:30 a.m. ET. On the surface, the report contained signals that should have pushed metals lower: core CPI, which excludes food and energy, rose 0.3% for the month, a tenth of a percentage point above consensus. That single-line surprise pushed the market to price in roughly a 90% chance of a quarter-point Fed rate increase at next week’s meeting, up sharply from about 70% before the release. Higher expected rates normally hurt gold because bullion yields nothing.
Despite that, spot gold traded near $4,389 an ounce and spot silver near $64.98, both up on the day. The explanation lies in a split signal inside the CPI. Headline CPI rose 0.4% for the month and was 3.4% year-over-year, matching July. But annual core inflation eased to 2.4% from July’s 2.5%—the slowest pace in years. In short, one important reading ran hotter while another ran cooler. That mixed outcome, more than a single surprise, drove much of the market’s reaction.
What Happens to Gold When Real Yields Are This High?
Real yields—nominal bond yields minus expected inflation—are typically the most reliable influence on gold. As of September 8, 2026, the 10-year real yield was about 2.43% (Federal Reserve H.15 data), with the nominal 10-year yield near 4.80% and climbing toward its highest levels in nearly three years. When real yields rise, Treasury returns become more competitive with gold, pressuring demand for non-yielding assets.
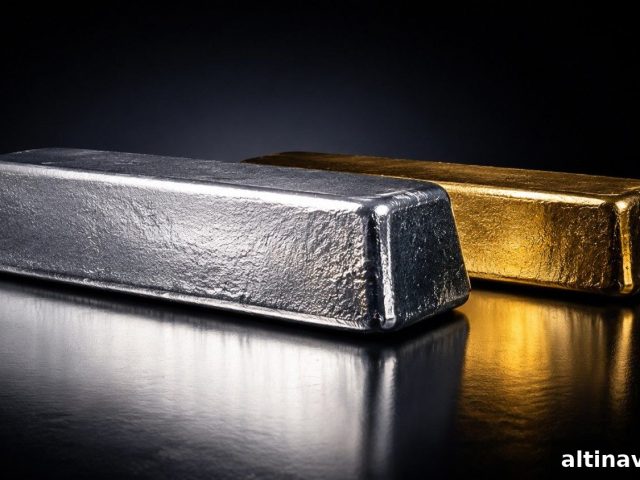
That dynamic explains the sharp sell-off in gold and silver on the prior trading day after the Producer Price Index (PPI) accelerated to 5.4% year-over-year. The PPI-driven move lifted Fed hike odds from roughly 60% to the low 70% range, and silver underperformed gold—falling about three times as much—because silver is more sensitive to growth expectations as well as real yields.
Why Didn’t Today’s Surprise Sink Gold the Same Way?
The CPI report should have intensified the repricing that started with the PPI, yet gold rose. The first clue to why is the dollar. The U.S. Dollar Index barely moved, remaining just above 99.00 through the session even as Fed-hike odds swung dramatically. When a significant hawkish repricing does not lift the dollar, gold loses one of the main channels that would push it lower.
A second clue comes from positioning. Commitments of Traders data for the week ending September 1, 2026, showed gold’s speculative net long position near the upper end of recent readings—even after the earlier sell-off. When a market is already heavily long, there are fewer sidelined buyers to accelerate gains on positive developments, but also fewer forced sellers left to push prices sharply lower on new hawkish news. That structural positioning helps explain why today’s larger hawkish surprise produced only a modest decline the other way and allowed bullion to rebound.
The Sound Money Angle
Beyond single data points, the broader backdrop remains meaningful. Headline inflation is running at 3.4% annually—well above the Federal Reserve’s 2% target—so real returns on cash and bonds are being eroded when policy rates lag inflation. That gradual loss of purchasing power is a structural tailwind for precious metals: over time, persistent positive inflation makes cash less attractive. One mixed CPI report does not change that underlying dynamic.
The Second Corner
Another point often missed: when the market fully prices in a Fed hike, there is little left for that pricing to do. The initial pain of repricing toward higher rates occurred with Thursday’s PPI. What remains uncertain—and what will drive markets—is how the Fed communicates after a hike. A single hike followed by signals that policy is done will be read very differently from a hike accompanied by clear indications of further tightening. Gold’s resilience today looks like a market bet that the committee may pause after tightening. That is a bet, not a certainty; the real answer will come from the Fed’s statements and actions next week.
What Should Investors Watch Next?
The Federal Open Market Committee meets September 15–16, 2026 and will announce its decision on September 16. Fed Chair Kevin Warsh, who led discussions at Jackson Hole on August 28, has been interpreted as saying the Fed still has work to do on inflation—so market pricing of a hike reflects that view. Investors should watch three things into the decision: the gold-silver ratio (near 67.5 at the time of the CPI release), the dollar’s behavior, and the Fed’s forward guidance. If the dollar finally rallies on a now-likely hike, gold’s short-term cushion could vanish quickly; if the dollar fails to follow higher hike odds, that decoupling itself becomes the more important story.
SOURCES
1. Bureau of Labor Statistics, Consumer Price Index Summary, August 2026 data, released September 11, 2026
2. CNBC, CPI inflation report August 2026, September 11, 2026 (includes CME FedWatch and Treasury yield data)
3. CBS News, coverage of August CPI report, September 11, 2026
4. FXStreet, U.S. Dollar Index coverage, September 11, 2026
5. CFTC, Commitments of Traders report, week ending September 1, 2026
6. Federal Reserve, H.15 Selected Interest Rates, September 8, 2026
Disclaimer: This article is for informational purposes only and does not constitute investment advice. Past performance is not indicative of future results. Always consult a qualified financial advisor before making investment decisions.
You May Also Like:
- Gold and Silver Fall as Hot PPI Lifts Fed Rate-Hike Odds
- Five Signals Pointing the Same Way Into Next Week’s Fed Decision
- Silver Underperforms Gold: The PPI Story Behind It
- Gold’s Tiny Output Is Worth Twice Aluminum’s: Four More Signals
- Fed Hike Odds: From 54% to 26% to 58%, Then a Coin Flip
- Gold ETFs Inflow and Silver ETF Outflows: Recent Fund Flows
Popular Topics
Picked from the archive
-
01
 Topics
How Profit Booking Works in Gold and Silver
-
02
Topics
Why Gold Is Still a Safe Haven, Says Switzerland’s Top Refiner
-
03
Topics
How Gold Prices Move During a US Dollar Crash
-
04
Topics
Why Silver Fell 12% While Gold Dropped Just 3%
-
05
Topics
Jobs Report Did What Iran Couldn’t: Gold and Fed Move in Sync
-
06
Topics
How to Buy Silver Bars: Investor Guide to Price and Purity
-
07
Topics
China Imported Over 1,000 Tonnes of Gold; PBOC Bought 80
-
08
Topics
Gold and Silver IRA: Why Starting Early Saves Money