China Breaks Its Own Gold Buying Record Twice

For the second month in a row, China’s central bank reported its largest monthly gold purchase since October 2023 — then it set a new monthly high the following month. That steady accumulation, more than the day-to-day price moves, is the developing story.
As of the latest update, gold is trading around $4,395 per ounce and silver near $65.63. Those short-term swings matter to traders, but the more important signal came today from Beijing: the People’s Bank of China continued its uninterrupted buying streak.
How Many Months Has China Been Buying Gold?
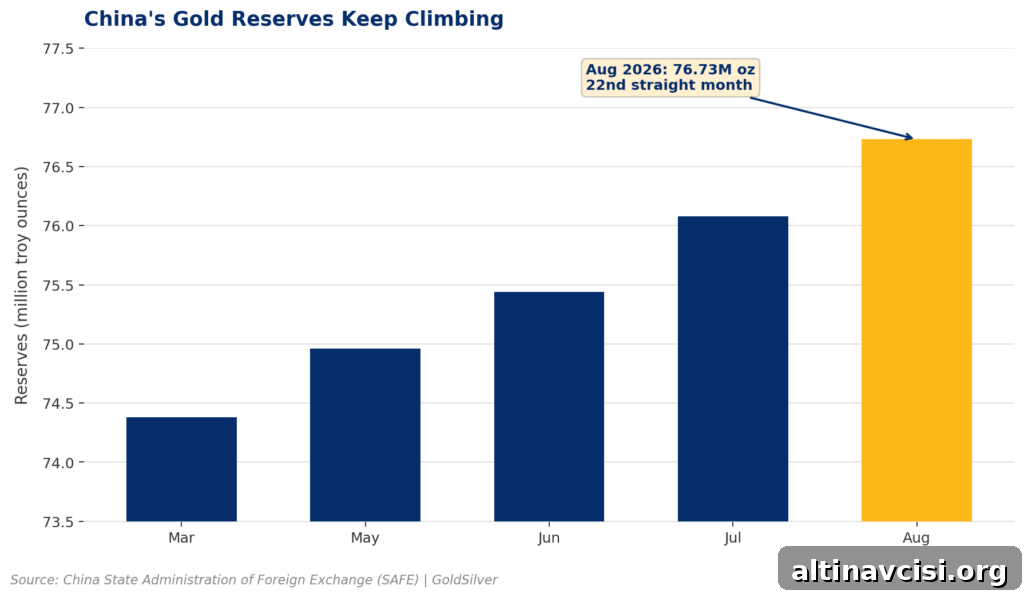
On September 7, 2026, China’s State Administration of Foreign Exchange (SAFE) reported that the People’s Bank of China added 650,000 troy ounces of gold in August. That addition extended the central bank’s uninterrupted buying streak to 22 months — the longest consecutive run on record.
Total official holdings now stand at 76.73 million troy ounces, roughly 2,386.57 tonnes, up from 76.08 million ounces in July. August’s reported addition topped July’s 640,000-ounce increase, which had itself been the largest single-month purchase since October 2023.
SAFE’s report also showed the reported dollar value of China’s gold reserves rising to $350.08 billion from $306.35 billion a month earlier. That roughly $43.7 billion increase reflects higher gold prices during August rather than new physical tonnage — twenty tonnes of metal remains twenty tonnes regardless of its market price.
Why Is China’s Central Bank Still Buying at These Prices?
Twenty tonnes per month is a modest amount compared with global supply: total mine production reached a record 3,672 tonnes in 2025, meaning a single month’s purchase by Beijing represents well under 1% of annual global mine output. On a purely supply basis, these additions are small.
What matters more than the monthly tonnage is the continuity. China has bought gold for 22 straight months even as the metal’s price swung widely — climbing above $5,500 in January, falling nearly 30% into the low $4,000s by late June, and then recovering into the $4,300s. That persistence suggests a strategic, long-term approach rather than a short-term trade based on timing the market.
Central banks purchase metals on the basis of reserve strategy and portfolio diversification, not to speculate on quarterly price moves. IMF data on the Currency Composition of Official Foreign Exchange Reserves (COFER) show the dollar’s share of global reserves has fallen from roughly 72% in 2000 to about 57% today, leaving room for gold and other assets to play a larger role. For a reserve manager running a multi-decade allocation plan, a lower monthly price and a higher monthly price look the same when the objective is long-term balance-sheet diversification.
What Do Other Reserve Managers Think Is Coming?
Survey data and industry commentary indicate most reserve managers expect further accumulation. The World Gold Council’s 2026 Central Bank Gold Reserves Survey found that 89% of central bank respondents expect global official-sector gold reserves to rise over the next 12 months, and a record 45% expect their own institution’s holdings to increase. Those are high readings for anticipated official-sector demand.
Market analysts have described China’s program as strategic and forward-looking. Gu Fengda, chief analyst at Guoxin Futures, characterized the accumulation as a deliberate deployment of reserves rather than a short-term trade — a description consistent with the uninterrupted buying through price fluctuations this year.
What Does This Mean for Gold and Silver Investors?
For investors, China’s program is a validation of gold’s role as a reserve asset rather than an immediate catalyst for dramatic price moves. Individual investors weighing physical ownership against paper exposure are effectively making a smaller version of the same decision central bankers face: should a portion of one’s portfolio sit in an asset with no counterparty risk and no dependence on another government’s balance sheet?
Central banks buy and hold gold for stability and protection against geopolitical or policy-driven risks — not because they expect it to double in the next quarter. The recent month-by-month additions underline that rationale: gold is held as an insurance asset that resists sanctions, freezes, or shifts in other countries’ monetary policy.
China has also been relocating part of its holdings to a new Hong Kong vault. That logistical move reinforces the impression that this gold is intended as long-term reserve stock, not short-term inventory to be turned quickly.
What Happens Next With China’s Gold Reserves?
SAFE’s next release, covering September, is expected in early October and will show whether August’s acceleration continues or moderates. That update will be the next official snapshot of China’s holdings and buying cadence.
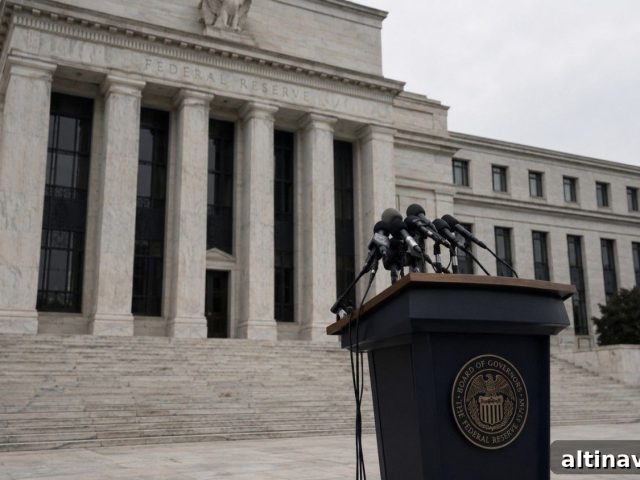
In the near term, U.S. economic releases — notably the Producer Price Index (PPI) and Consumer Price Index (CPI) prints — along with the evolving odds of a U.S. Federal Reserve rate move, will influence gold and silver prices on a day-to-day basis. Those market calendars operate on a short, data-driven cycle. China’s reserve purchases run on a different timetable: a longer-term allocation plan that is largely independent of monthly market noise. Both schedules matter, but they answer different questions.
SOURCES
1. PANews (citing Jinshi/China SAFE data) — China’s Central Bank Increases Gold Reserves for 22nd Consecutive Month, September 7, 2026
2. The Deep Dive — China’s Central Bank Buys the Most Gold Since October 2023, September 7, 2026
3. Bloomberg — China’s Central Bank Extends Gold Buying Streak to 21 Months, August 7, 2026
4. FX.co — China’s FX Reserves Rise More than Expected, September 7, 2026
5. CGTN — China’s Central Bank Extends Gold-Buying Streak to 19th Straight Month (commentary from Gu Fengda, Guoxin Futures), June 7, 2026
6. World Gold Council — Central Bank Gold Reserves Survey 2026, Perspectives on Gold Reserves, June 16, 2026
7. International Monetary Fund — COFER data brief, 2026 Q1, published June 30, 2026
8. World Gold Council — Gold Demand Trends, Full Year 2025 (Supply), January 29, 2026
9. GoldSilver — Gold and Silver Price Charts, September 7, 2026
Disclaimer: This article is for informational purposes only and does not constitute investment advice. Past performance is not indicative of future results. Always consult a qualified financial advisor before making investment decisions.
You May Also Like:
- The BLS Revised April Up 64,000, Then Down 31,000. Gold Traded the First Print.
- Gold’s Drop Was the Easy Story. The Bond Market’s Non-Reaction Is the Real One.
- Gold and Silver Drop as August Payrolls Blow Past Forecasts. Four Other Threads Moved Today Too.
- The Fed Just Priced Out Half a Rate Hike. Gold Barely Noticed.
- Gold Up, Silver Up. The Five Reasons Behind It Don’t All Agree.
- Barrick Just Delayed Its Biggest Move in Years. Gold Isn’t Why.
- Gold ETF Outflows Came From One Region. The Buying Came From Everywhere Else.
Popular Topics
Picked from the archive
-
01
 Topics
Federal Reserve Goes Silent: Why Gold Investors Don’t Need It
-
02
Topics
Goldman Cuts Gold Target, JPMorgan Holds: $1,400 Gap Explained
-
03
Topics
PMI Beat Moves Gold Price Two Ways: Markets Priced Only One
-
04
Topics
How to Spot Fake Gold and Silver: Key Tests and Warning Signs
-
05
Topics
Deutsche Bank Identifies Gold Price Floor: Surprise Buyers
-
06
Topics
Gold Pullback Driven by Treasury Buyback, Not ETFs
-
07
Topics
Dollar Devalued 87% Since 1971: Why Central Banks Buy Gold
-
08
Topics
Prediction Market Files to Let Gold Trade 24/7 Forever