Gold Market Split: Short-Term Sellers vs Long-Term Buyers
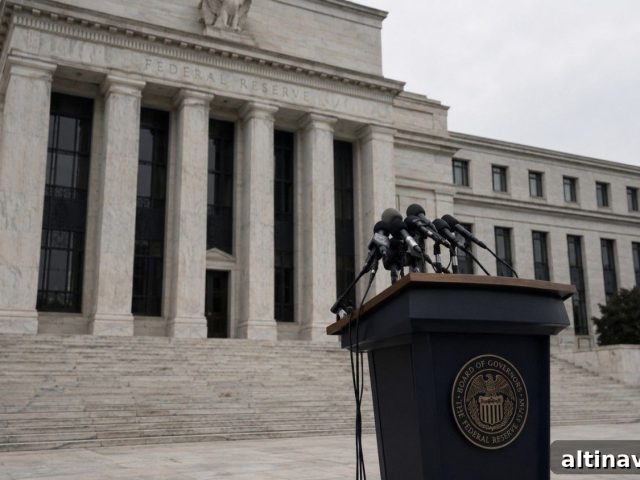
Gold fell more than 2% on Tuesday, September 1, with silver dropping even more sharply. The move was straightforward: markets shifted from expecting the Federal Reserve to pause to pricing in a rate increase. Safe-haven assets with no yield tend to be repriced lower when borrowing costs rise. By Wednesday afternoon, gold had reclaimed the low $4,300s and silver traded back near $65. The more important question is who is selling gold at the same time that official buyers — central banks and reserve managers — continue to accumulate. Five developments across 48 hours, each tied to specific institutions and data, help explain what’s happening. They point to two distinct markets operating on different time horizons: one reacting to short-term rate expectations, the other managing reserve risk over years or decades.
Why Did the Dutch Central Bank Move 86 Tonnes of Gold to London?
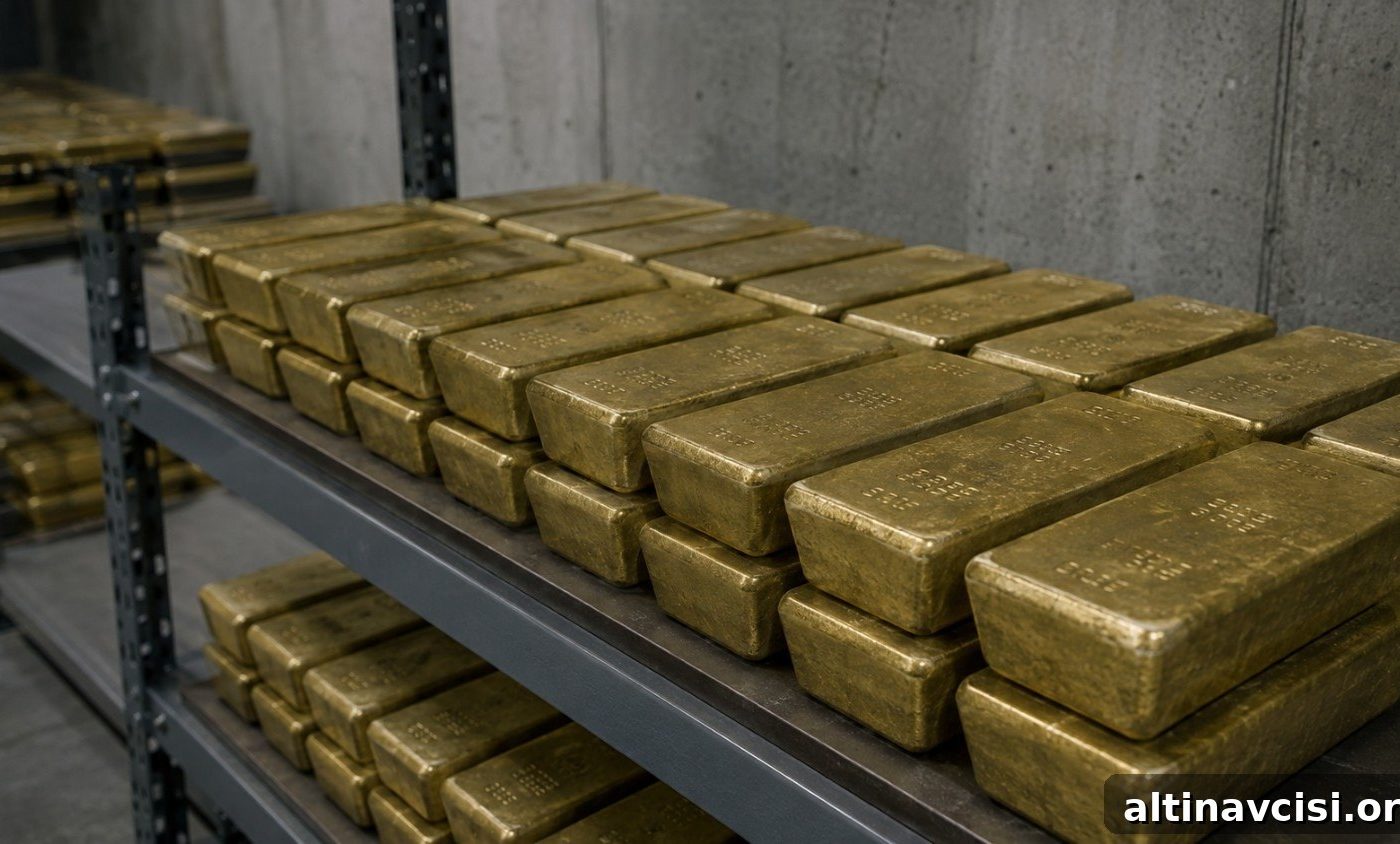
De Nederlandsche Bank transferred about 86 tonnes of gold out of vaults in New York and Ottawa between March and August. That amount equals more than a quarter of the roughly 313 tonnes the central bank held in those two North American locations. New York’s share of Dutch holdings fell from 31.3% to 18.5%, Ottawa’s from 19.7% to 18.5%, while London’s share rose from 18.1% to 32.1%.
Governor Olaf Sleijpen described the move as a decision driven by tradability and logistics rather than a market-timing bet. By consolidating more bars in London, DNB can access and deploy reserves faster when needed. Execution details matter: only around 27 tonnes were physically shipped; the remainder were swapped through buy/sell transactions, avoiding melting and recasting of bars. Vault location is a deliberate policy choice for central banks that balances security, liquidity and operational readiness.

The Edge Every Investor NeedsSmarter precious metals investing starts with clear, timely analysis. Get market insights, Fed updates and global trends delivered in concise updates.
Who Is Selling Gold, If Central Banks Keep Buying It?
Deutsche Bank’s research suggests the recent selling pressure came mainly from commercial and retail holders, not from trend-following funds that many observers blame. Daniel Ghali, head of metals research, argued that spot selling has largely run its course and that commodity trading advisers (CTAs) were buyers into that selling rather than its originators. Deutsche Bank identified a tactical threshold: if spot gold stays above roughly $4,315 per ounce, systematic selling is unlikely to cascade further. Below that level, additional mechanical selling could be triggered.
Discretionary macro funds largely sat out the late-summer rally, making them potential buyers rather than sellers on any renewed weakness. For context, the settlement on Tuesday and the session low on Wednesday both landed within about half a percent of the $4,315 line, highlighting how closely market action tracked those technical thresholds.
Do Wall Street’s Positioning Desks Actually Agree With Each Other?
No — and the contrasting public notes this week illustrate why. Shortly after Deutsche Bank published its view, TD Securities released an opposing tactical read of the same positioning data. TD analysts Ryan McKay and Bart Melek warned that CTA selling thresholds could come into play closer to $4,300, with simulations pointing toward potential weakness to the $4,200–$4,100 area. Their analysis also noted that markets had begun to price in more rate increases for 2027, but they still see limited long-term downside for gold because concerns about currency debasement and central bank accumulation remain valid.
It’s notable that the two analyses share a data lineage — Ghali once ran TD’s metals desk — yet they reached different tactical conclusions from the same dataset. That divergence highlights how identical inputs can produce varying risk tolerances and buy/sell thresholds across desks.
What Happens to Gold if the Sellers’ Rate Forecast Is Wrong?
This question moved markets twice during the week. On Wednesday, ADP reported private payrolls rose by just 38,000 in August — below the 47,000 Dow Jones consensus and the smallest monthly gain since January. Manufacturing payrolls fell by 17,000. Gold turned positive within the trading session on the softer jobs signal.
Separately, U.S. Treasury official Scott Bessent met with Bank of Japan Governor Kazuo Ueda, and the U.S. Treasury said Bessent urged “decisive” steps to combat yen weakness. That interaction underscores a rare moment when one government publicly encourages another central bank to tighten policy to support its currency against the dollar. Markets are closely watching the Bank of Japan’s meeting on September 17–18, just two days after the Fed’s decision, and Japan’s 10-year government bond yield has already moved significantly higher.
How Did Gold Rise Strongly in August While Hike Odds Rose Sharply?
Because two investor cohorts were pulling in opposite directions and the longer-term, slower-moving buyers won August. Gold rose about 9.6% for the month — its best performance since January — and silver gained roughly 15%. Over the same period, markets pushed September hike odds higher after hawkish Fed commentary, with probabilities climbing from the mid-30s to the mid-60s. The key signal was a move in real yields: the 10-year inflation-indexed Treasury yield bottomed at 2.32% on August 25 and rose to 2.44% by August 31, roughly coinciding with gold’s peak and subsequent partial retracement.
Some banks remain constructive on gold’s medium-term outlook. UniCredit increased its year-end 2026 range, citing sustained central bank buying, a steepening Treasury curve and renewed ETF inflows as supportive pillars for higher prices.
So What Should a Long-Term Holder Take From This Week?
Short-term trend-following funds and long-term reserve managers answer different questions. A CTA asks where gold is likely to trade in a few weeks; at current real yields, selling is a defensible short-term response. A central-bank reserve manager asks whether gold will preserve purchasing power across uncertain political and financial regimes. Interest rates do not change that fundamental question. De Nederlandsche Bank’s relocation was not a bet on the September FOMC; it was an operational decision to make metal more accessible in an unpredictable future.
Central banks set a broader backdrop by buying record amounts — the World Gold Council reported strong official sector demand — while positioning and short-term flows can produce abrupt price moves. Two dates will test the sellers’ premise in the short run: the U.S. payrolls release for August and the Fed’s policy decision on September 16. This week’s positioning shift altered near-term dynamics, but it did not negate the structural drivers supporting gold over longer horizons.
SOURCES
1. De Nederlandsche Bank, “DNB relocates part of its gold stock to London,” September 2, 2026
2. Bloomberg, “Dutch Central Bank Transfers 86 Tons of Gold From US, Canada to UK,” September 2, 2026
3. Associated Press, “Dutch central bank shifts billions in gold to London in ‘crisis preparedness’ move,” September 2, 2026
4. Deutsche Bank Research, metals note, Daniel Ghali, September 1, 2026
5. TD Securities, commodity strategy note, Ryan McKay and Bart Melek, September 2, 2026
6. ADP Research, ADP National Employment Report, August 2026, released September 2, 2026
7. CNBC, “Private payrolls rose by 38,000 in August, fewer than expected, ADP reports,” September 2, 2026
8. Reuters via The Japan Times, “Bessent urges BOJ chief to combat weak yen with ‘decisive’ monetary steps,” September 1, 2026
9. Reuters, “BOJ chief signals chance of September rate hike, debate on price risks,” September 1, 2026
10. CNBC, “Gold slips to near two-week low on Fed rate hike bets,” August 31, 2026
11. Federal Reserve Economic Data, series DFII10, 10-Year Treasury Inflation-Indexed Security, constant maturity, observations through August 31, 2026
12. UniCredit Research, gold forecast update, September 2, 2026
13. World Gold Council, Gold Demand Trends Q2 2026, July 30, 2026
14. CME Group, FedWatch Tool, September rate-hike probability, accessed September 2, 2026
Disclaimer: This article is for informational purposes only and does not constitute investment advice. Past performance is not indicative of future results. Consult a qualified financial advisor before making investment decisions.
You May Also Like:
- The Iran War Just Got Worse. Gold Barely Noticed.
- Silver Is Falling Faster Than Gold Today. Its Deficit Didn’t Change.
- Wall Street Keeps Buying Gold. Washington Keeps Sending Mixed Signals.
- Iran’s Gold Sector Just Got Named in U.S. Sanctions. Gold Is Selling Off Anyway.
- Hike Odds Doubled This Week. Real Yields Didn’t.
- COMEX Registered Gold Just Fell Below 15 Million Ounces. It’s Still Refilling.
- Gold Isn’t Falling on a Hawkish Fed. Here’s Why.
Popular Topics
Picked from the archive
-
01
 Topics
Federal Reserve Goes Silent: Why Gold Investors Don’t Need It
-
02
Topics
Goldman Cuts Gold Target, JPMorgan Holds: $1,400 Gap Explained
-
03
Topics
PMI Beat Moves Gold Price Two Ways: Markets Priced Only One
-
04
Topics
How to Spot Fake Gold and Silver: Key Tests and Warning Signs
-
05
Topics
Deutsche Bank Identifies Gold Price Floor: Surprise Buyers
-
06
Topics
Gold Pullback Driven by Treasury Buyback, Not ETFs
-
07
Topics
Dollar Devalued 87% Since 1971: Why Central Banks Buy Gold
-
08
Topics
Prediction Market Files to Let Gold Trade 24/7 Forever