Why Gold Climbed After an 8% Oil Spike — What’s Different
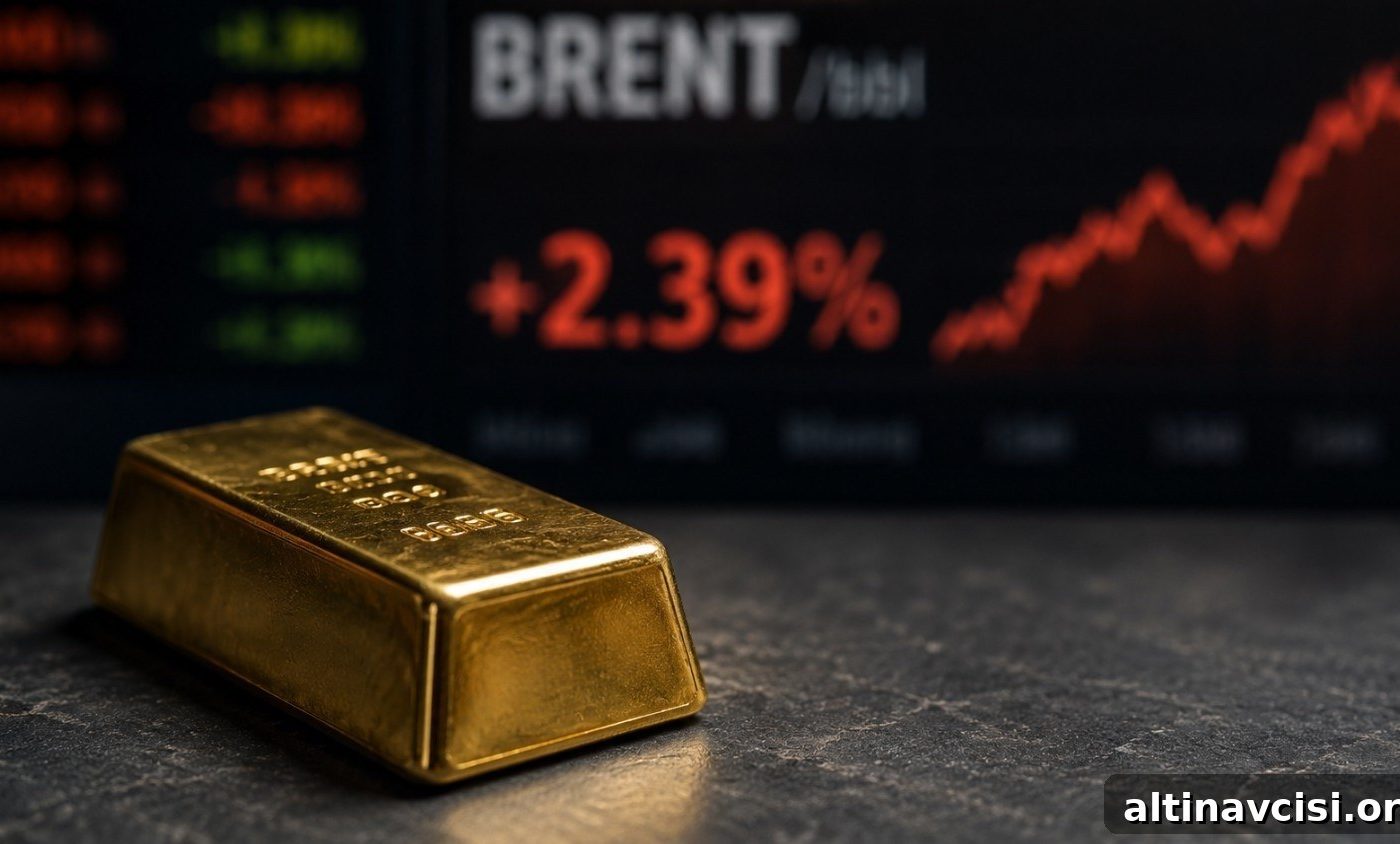
The U.S. Strategic Petroleum Reserve has fallen to its lowest level since Ronald Reagan’s first term — and the gold market reacted before many analysts did. On Thursday morning, gold traded near $4,078, a modest gain after Brent crude spiked nearly 8% the previous day to about $90.74 amid renewed U.S.–Iran military exchanges. Historically this kind of oil shock has pushed gold lower; this time the pattern broke.
Across much of 2026, sudden Brent rallies tied to Middle East tensions translated into higher inflation expectations, stronger odds of Federal Reserve rate hikes, rising real yields and, ultimately, pressure on non-yielding assets like gold. That chain held through multiple Iran-driven oil jumps earlier in the year — until July 29, when Brent jumped and gold rose instead of falling.
Brent crude vs. gold spot — indexed to June 1, 2026
Five prior oil spikes pushed gold lower. July 29 broke the pattern.
Gold spot
▏ Prior spikes: gold fell
▏ Jul 29: gold rose
Chart removed: Indexed line chart showing Brent crude and gold spot from June 1 to July 30, 2026. On several Iran-driven spikes gold fell; on July 29 Brent surged and gold rose, breaking that earlier pattern.
Source: goldsilver.com/price-charts · Brent: Reuters/CME · Approximate daily closes, June 1–July 30, 2026.
Why Does an Oil Spike Usually Push Gold Down?
For much of 2026 the link between Brent crude and gold followed a clear three-step route. First, geopolitical tension — often involving Iran — pushed Brent higher. Second, higher oil feeds into consumer prices and raises inflation expectations because energy costs permeate the economy. Third, rising inflation expectations increase the likelihood of Federal Reserve rate hikes. Higher expected rates and rising real yields make holding non-yielding gold relatively less attractive, so gold often falls when oil spikes.
This mechanism showed up repeatedly: in March, May and again on specific July dates when Iran-related events lifted Brent and gold weakened. Those episodes illustrate how oil-driven inflation fears can translate quickly into higher real yields and downward pressure on gold.
But on July 29 the usual sequence did not fully play out: Brent jumped and gold climbed. Understanding why requires looking at a few concurrent developments that altered the transmission from oil to yields to gold.

The Edge Every Investor NeedsSmarter precious metals investing starts here. The Nuggets Newsletter delivers market insights, Fed updates, global trends and educational analysis straight to your inbox.
Subscribe for concise market updates and price alerts. Form removed for this static version.
What Is Different About Today’s Oil Spike?
Three factors converged on July 29 to interrupt the usual suppression chain linking oil spikes to falling gold:
1) The rate-hike signal was largely priced in. The Federal Open Market Committee’s 9–3 vote to hold rates sent a clear hawkish signal that markets immediately absorbed. By the time Iran’s missile activity drove oil higher later that day, much of the Fed-related repricing had already been reflected in asset prices. In other words, the oil move did not add materially to rate-fear that day.
2) Oil did not keep accelerating after the initial jump. Brent settled near $90–$91 rather than running to a new, sustained high. When crude does not continue a sharp, multi-session surge, the incremental inflation signal is smaller and less likely to force immediate Fed action. Continued shipping through the region also limited the perceived supply shock.
3) The Strategic Petroleum Reserve is much lower than before. The U.S. SPR dropped to about 307.7 million barrels for the week ending July 24 — the lowest level since March 1983. Over the past four years the reserve has been drawn down by hundreds of millions of barrels, and some of the remaining inventory faces usability constraints due to aging infrastructure. That structural change reduces the government’s capacity to blunt future oil shocks and increases the likelihood that a Brent surge will feed more directly into consumer prices.
Why Does the SPR Level Matter for Gold?
The SPR was created to act as a buffer that absorbs supply shocks before they reach consumers. When the U.S. releases oil from the reserve during periods of Middle East tension, it can dampen the pass-through from higher crude to inflation. In 2026, SPR releases helped slow the transmission of select Iran-driven spikes into CPI, reducing immediate pressure on the Fed.
With the SPR below 310 million barrels and a portion of stocks effectively unavailable due to infrastructure issues, that cushion is thinner. A diminished reserve shortens the lag between an oil shock and visible inflation — and that shortens the path from geopolitical events to monetary-policy reactions. Markets perceive this, and gold tends to respond because physical metal is often seen as a hedge when monetary credibility or purchasing power is at risk.
What Do Institutions Say About Gold’s Current Level?
Recent institutional commentary has been mixed but still supportive over the medium term. For example, Commerzbank adjusted its year-end target to $4,500, citing a persistently hawkish Fed and a stronger dollar; that target still implies roughly 10% upside from the levels observed at the end of July. Many analysts continue to highlight central-bank buying, fiat-currency skepticism and long-term demand dynamics as fundamental supports for gold.
For perspective, gold is roughly 24% higher over the past 12 months despite a meaningful correction from the January peak near $5,589.
What Should You Watch Next?
Two key items will determine whether July 29’s divergence persists or reverses:
1) Brent crude action over the coming days. If Brent remains in the roughly $87–$92 band and crude shipments through the Gulf stay largely uninterrupted, the inflation-expectation channel stays muted and gold avoids renewed real-yield pressure. If Brent decisively pushes back toward $100, the old suppression chain could reassert itself — but the SPR’s reduced capacity means inflationary effects may arrive faster than in prior episodes.
2) Fed hike probabilities for September. Watch CME FedWatch odds: if markets move toward a 90%+ chance of another hike, upward pressure on real yields would likely return, which would be a headwind for gold. If probabilities pull back below roughly 70%, gold would have clearer room to test higher resistance levels near $4,200.
A single day’s price action does not determine the structural case for holding physical metal. Still, that July 29 divergence is meaningful: five times earlier in 2026 oil spikes pushed gold lower. This time the pattern broke — and the depleted Strategic Petroleum Reserve is a key reason why markets are thinking differently about the risk of future shocks.
Stay On Top of Gold & Silver Prices
Get timely price alerts and essential market updates delivered to your inbox.
SOURCES
1. GoldSilver — Live Gold and Silver Spot Prices
2. Reuters / U.S. Department of Energy — SPR weekly inventory, week ending July 24, 2026
3. CNBC — reporting on SPR infrastructure and oil-market developments
4. Federal Reserve — FOMC statement, July 29, 2026
5. CME Group — FedWatch tool (rate-hike probabilities)
Disclaimer: This article is informational only and does not constitute financial or investment advice. Consult a qualified financial adviser before making investment decisions.
You May Also Like:
- Gold Is Up $40. Here Is What the 9–3 Fed Vote Actually Means.
- Iran Fired Missiles. Oil Spiked 6%. Gold Fell. The Three-Step Chain Behind the Move.
- Everyone Is Watching the Fed. Gold Is Watching Tomorrow at 8:30 a.m.
- Gold Is Down $48. Here Are the Five Reasons Why.
- Consumer Confidence Fell for the Third Month in a Row. Gold Fell Too. They’re Not the Same Signal.
- Hike Odds Doubled. Gold Is Down $46. Here Is Why.
Popular Topics
Picked from the archive
-
01
 Topics
Gold Prices Rise for Seventh Week as Jobs Data Goes Dark
-
02
Topics
Gold Silver Ratio Forecast: Buy Gold, Add Silver or Wait?
-
03
Topics
Iran’s War Deadline Sparks Gold and Silver Price Volatility
-
04
Topics
Silver Breaks Above $92 as Citi Sees $100 by March
-
05
Topics
Gold vs Inflation: What 100 Years of Data Reveals
-
06
Topics
Why Central Banks Are Quietly Buying Gold
-
07
Topics
Inflation Holds at 3.0%, Gold Funds Post Historic Rally
-
08
Topics
Gold Prices: 5 Forces Investors Are Watching Now