Why Gold Fell $46 as Interest Rate Hike Odds Doubled

Gold opened this morning near $4,030 per ounce, down about $46 from yesterday’s open. Silver traded around $57.39, down roughly $1. Both metals slipped as the Federal Reserve began its two-day July meeting; the decision is scheduled for tomorrow, July 29, at 2:00 p.m. ET.
This pullback is not driven by developments in Iran — the three-day ceasefire remains in effect — nor by any overnight news stories. Oil prices are actually lower this week. Instead, the move in precious metals traces to a key market indicator that shifted quietly over the past two weeks but received little headline attention.
Why Did Hike Odds Double in Two Weeks?
On July 14, the Bureau of Labor Statistics reported that headline inflation slowed from 4.2% in May to 3.5% year-over-year in June. That single CPI print reduced the market’s implied probability of a rate increase at this meeting from roughly 46% to about 16% (CME Group FedWatch). Gold rose on that news.
Since then, those odds have steadily climbed. By Monday, July 27, the CME FedWatch tool placed the probability of a 25 basis point hike at about 36.5%, with a roughly 63.5% chance of no change. That more-than-20-percentage-point rebound in two weeks was driven mainly by two forces: a JOLTS report showing job openings at their highest level in two years, and a sharp rise in oil earlier in July (before this week’s partial pullback). Even with the ceasefire, higher energy prices have kept upward pressure on inflation expectations and thus on rate-hike odds.
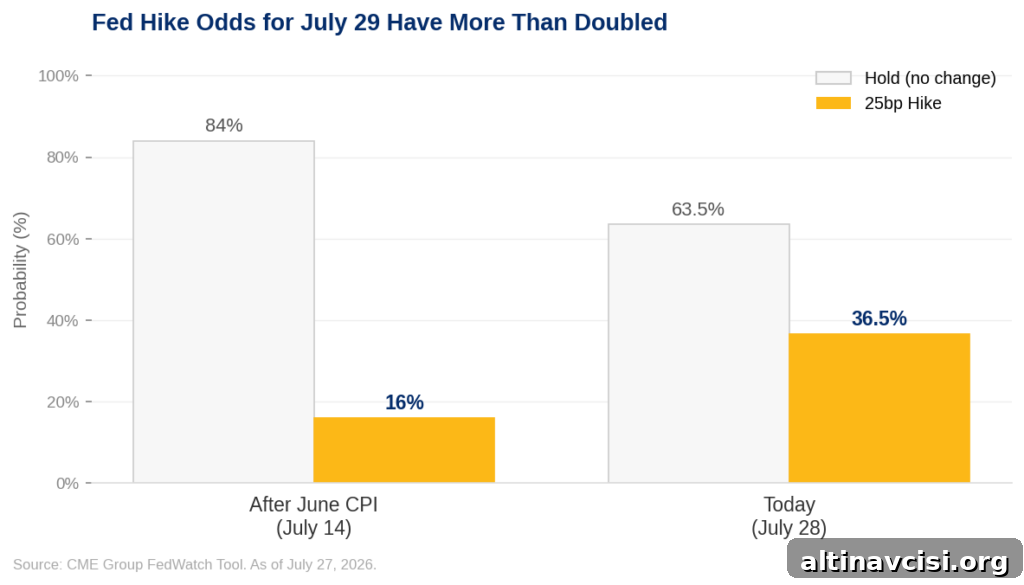
A higher probability of a rate hike directly affects gold and silver prices through interest-rate dynamics and bond yields — the relationship that drives short-term precious metals moves.
The Edge Every Investor Needs
Smarter precious-metals investing starts here. The Nuggets newsletter delivers market insights, Fed updates, inflation trends, educational videos, and concise analysis tailored to gold and silver investors.
Subscribe on the site to receive timely alerts and concise analysis about gold, silver, inflation, and Fed policy.
What Does a Fed Rate Hike Actually Do to Gold?
The link between rate expectations and gold operates through a straightforward chain of market reactions.
First, when markets price in higher Fed tightening, nominal Treasury yields typically rise. The 10-year U.S. Treasury yield has moved from around 4.30% six weeks ago to roughly 4.64% today (U.S. Treasury data).
Second, if nominal yields rise faster than inflation expectations, real yields — the inflation-adjusted return on government bonds — increase. Real yields are what investors earn after accounting for inflation.
Third, bullion pays no interest or dividend. When real yields climb, the opportunity cost of holding non-yielding gold rises: investors can earn more from inflation-adjusted bonds than before.
Fourth, higher real yields typically push gold prices lower as investors rebalance away from zero-yield assets to higher real-return alternatives.
This mechanism is supported by institutional research. For example, PIMCO analysis shows that movements in real yields explain much of gold’s short-term price behavior. Historically, a 25 basis point rise in the real yield often corresponds to roughly a $40–$60 decline in gold — a range that matches today’s approximately $46 move.
Why Is the Structural Case for Gold Still Intact?
Short-term rate movements matter, but they do not erase gold’s longer-term structural drivers. One of the key constraints is public debt and the fiscal cost of elevated rates.
By mid‑2026, total U.S. gross national debt exceeds $39 trillion and annual interest payments have topped $1 trillion. Each rate increase raises the federal government’s cost of servicing that debt. Over time, rising rates can push interest costs into a feedback loop that markets and policymakers will seek to avoid for fiscal stability.
Markets already price a limit to Fed tightening: while September hike odds remain elevated, futures markets increasingly favor a rate ceiling by year‑end rather than an open-ended tightening campaign. That implied ceiling supports a structural bid for gold even as short-term pressures fluctuate.
Remember: this week’s FOMC announcement does not include a Summary of Economic Projections or a dot plot. The statement and Fed Chair remarks (scheduled for 2:30 p.m. ET) will be scrutinized for any clues about September. Equally important is the June PCE report — the Fed’s preferred inflation gauge — due Thursday at 8:30 a.m. ET (Bureau of Economic Analysis). A soft PCE print could re-open the question of whether this week’s rise in hike odds is a brief spike or the start of a more durable shift.
Stay On Top of Gold & Silver Prices
Get market alerts and concise analysis delivered to your inbox.
Live price widget disabled.
Sign up on our site for timely updates on gold, silver, inflation, and Fed policy.
SOURCES
1. GoldSilver — Live Gold and Silver Spot Prices, July 28, 2026
2. Bureau of Labor Statistics — Consumer Price Index Summary, June 2026
3. CME Group — FedWatch Tool, July 2026 FOMC Rate Probabilities
4. U.S. Department of the Treasury — Daily Treasury Yield Curve Rates
5. PIMCO — Analysis on gold and real yields
6. U.S. Treasury — Fiscal data on national debt and interest costs
7. Bureau of Economic Analysis — Personal Income and Outlays / PCE schedule
Disclaimer: This article is for informational purposes only and does not constitute financial or investment advice. Consult a qualified financial adviser before making investment decisions.
You May Also Like:
- The Fed Votes Wednesday. Watch the Tally, Not the Decision.
- Oil Dropped 7%. Gold Rose. Here Is the Mechanism Everyone Misses.
- Oil Spiked 7% Yesterday. Silver Sold Off. Today Physical Buyers Are Doing Something Different.
- Newmont Earned $2.2 Billion Last Quarter. Gold Was Down 13%.
- The U.S. Holds Over $1 Trillion in Gold. Official Books Show a Much Lower Value.
- 187,000 Jobless Claims — The Lowest of 2026. What It Means for Gold.
Popular Topics
Picked from the archive
-
01
 Topics
Gold Prices Rise for Seventh Week as Jobs Data Goes Dark
-
02
Topics
Gold Silver Ratio Forecast: Buy Gold, Add Silver or Wait?
-
03
Topics
Iran’s War Deadline Sparks Gold and Silver Price Volatility
-
04
Topics
Silver Breaks Above $92 as Citi Sees $100 by March
-
05
Topics
Gold vs Inflation: What 100 Years of Data Reveals
-
06
Topics
Why Central Banks Are Quietly Buying Gold
-
07
Topics
Inflation Holds at 3.0%, Gold Funds Post Historic Rally
-
08
Topics
Gold Prices: 5 Forces Investors Are Watching Now