Why Oil Plunged 7% and Gold Rose: The Missing Market Mechanism
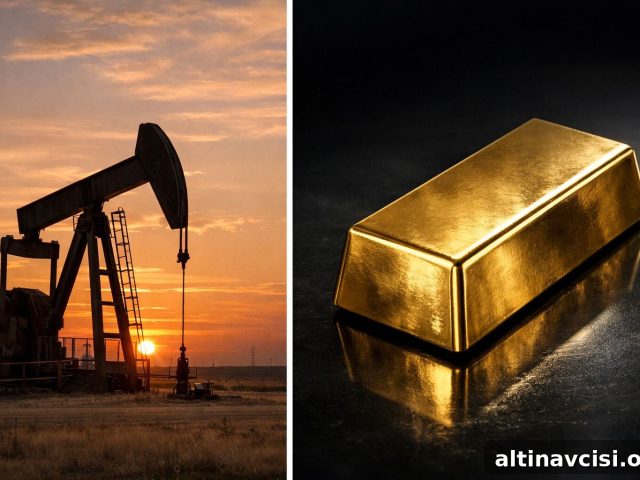
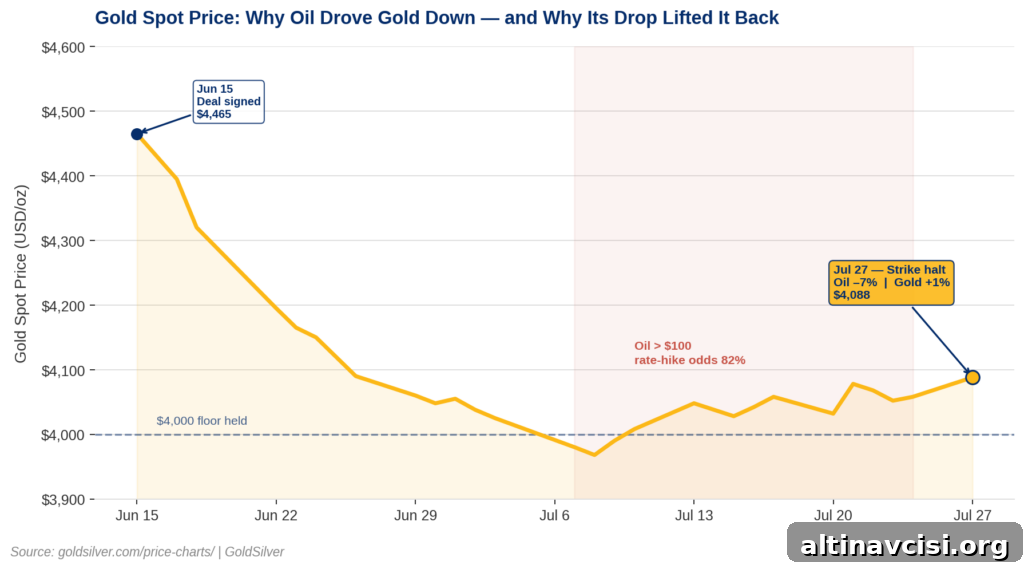
Gold rose more than 1% on Monday, July 27, 2026, trading near $4,088 per ounce after oil prices plunged roughly 7% when the United States and Iran paused a 13-night exchange of strikes over the weekend. Silver outperformed gold, climbing more than 2% to about $59 per ounce. Both moves reflect the same underlying market dynamic — and that dynamic is not the headline most readers will expect.
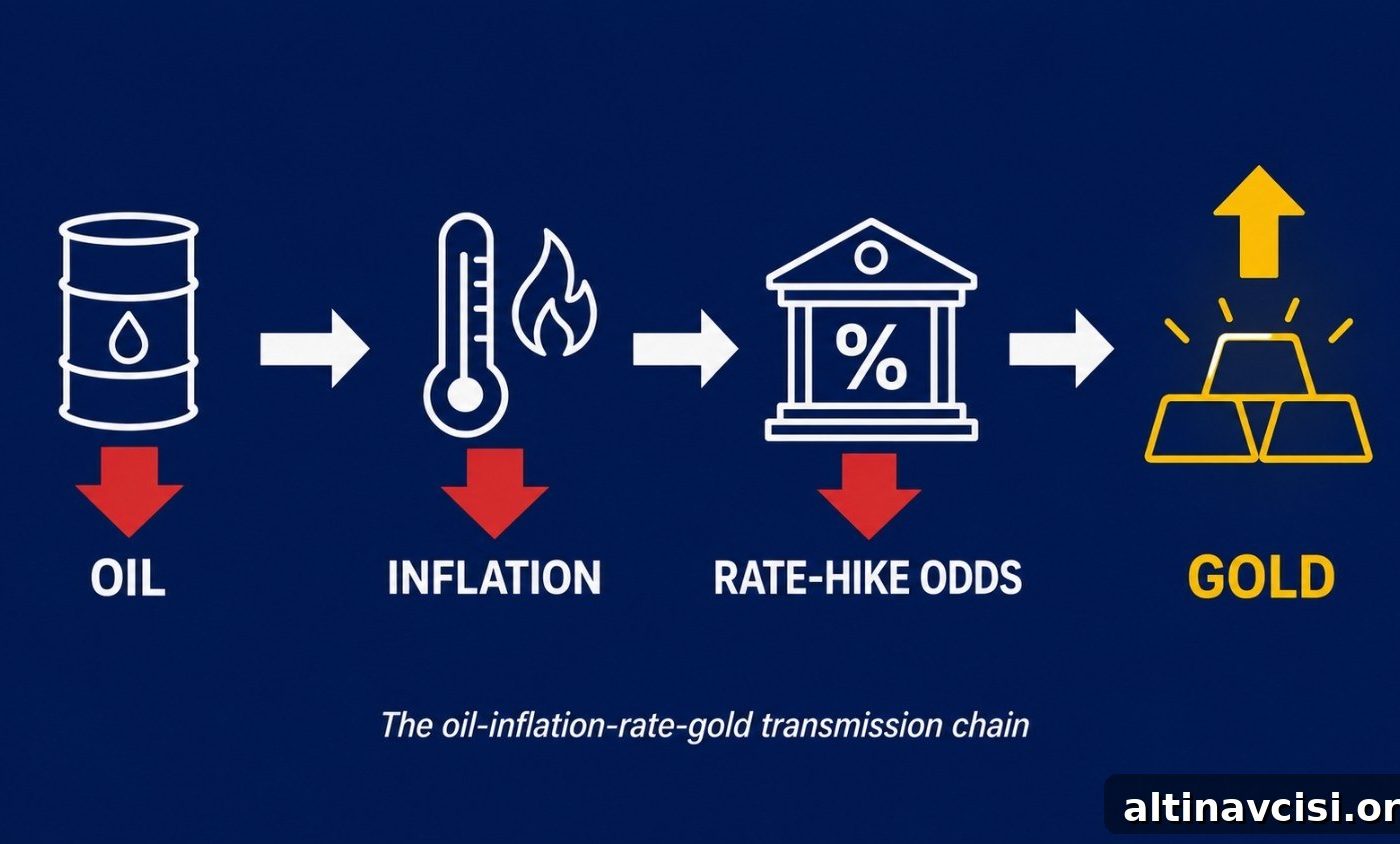
In short: lower oil prices reduce inflation expectations, which reduces the probability of near-term interest rate hikes, which in turn reduces the opportunity cost of holding non-yielding assets such as gold. A fuller explanation clarifies why gold initially fell as the conflict escalated and why that relationship reversed as oil dropped.
Why Did Gold Fall During the Iran War — and Rise When Oil Did?
Gold is commonly viewed as an inflation hedge. When the US-Iran conflict intensified on February 28, 2026 and oil surged above $100 per barrel, many expected gold to rally. Instead, gold declined roughly 12% from pre-conflict levels to nine-month lows last week, after already falling from its January record high.
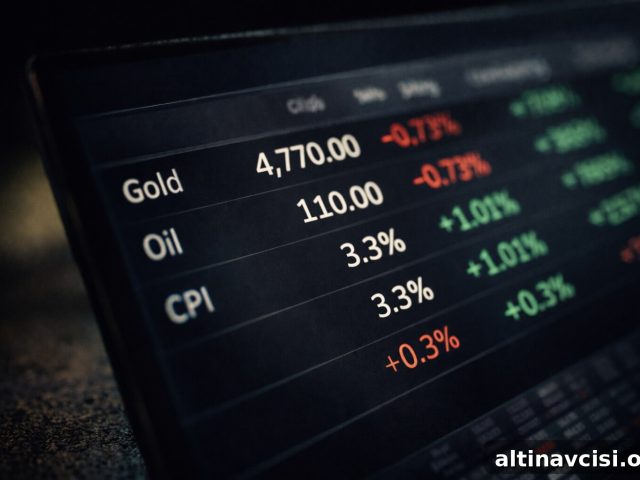
The transmission mechanism works in three steps. First, a rise in oil pushes headline inflation higher. Second, higher inflation increases the likelihood that central banks will raise interest rates, which raises the market-implied probability of near-term rate hikes. Third, as expected interest rates rise, the opportunity cost of holding a non-yielding asset like gold increases, making gold less attractive versus yield-bearing alternatives. During the conflict, this sequence helped push gold lower even as oil spiked; the recent drop in oil has worked in the opposite direction.
The Edge Every Investor Needs
Smarter precious metals investing begins with clear, timely analysis. Subscribe for market updates, Fed coverage, and essential bullion insights.
Subscribe to receive concise gold and silver market alerts by email. (Form removed from this version.)
What Is Happening With Gold Prices Today?
The unannounced pause in strikes began over the weekend after a senior Iranian official told Reuters that Tehran would maintain its halt as long as the United States did the same. US Ambassador Mike Waltz confirmed the pause on Fox News Sunday and said the pause created space for diplomacy. The market reaction was immediate: Brent crude fell roughly 7–8% on Monday to below $90 per barrel, its lowest level since mid-July.
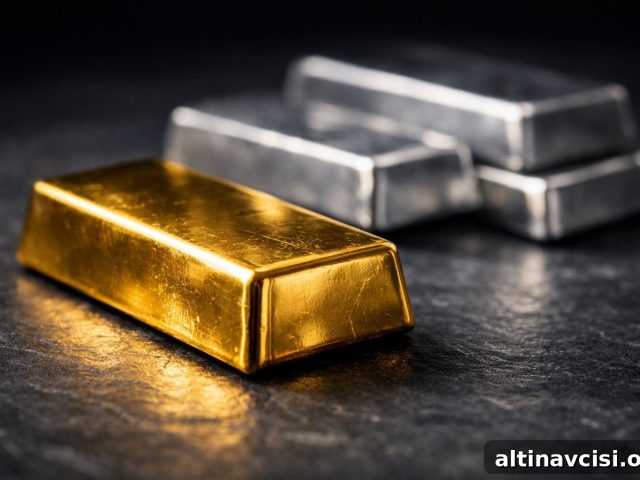
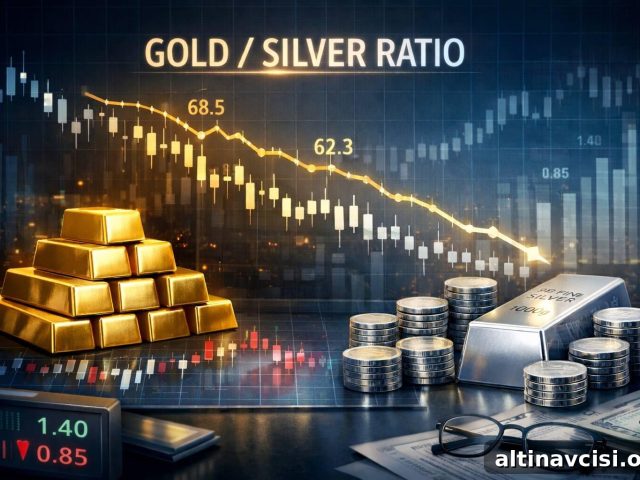
As market expectations for a near-term rate hike eased, the opportunity cost of holding gold declined and buyers stepped back in. Silver benefited more strongly because it has both industrial demand and monetary/precious-metals demand; when rate-hike fears receded, both demand components improved. The gold-to-silver ratio tightened modestly as a result.
That said, the rally comes with important caveats. The Strait of Hormuz remains legally and operationally sensitive, Houthi forces attacked Red Sea energy infrastructure over the weekend, and no formal, documented agreement between Washington and Tehran exists. In short, this is a pause in hostilities, not a comprehensive resolution.
What Does the Iran Pause Mean for the Fed’s July 29 Decision?
The Federal Reserve begins a two-day meeting on Tuesday, July 28, with the rate decision scheduled for Wednesday, July 29 at 2:00 PM ET and the post-decision press conference at 2:30 PM ET. As of the last trading session, markets were pricing a material probability that the Fed would hold rates.
A sharp drop in oil eases inflationary pressure and reduces the argument for an immediate policy tightening from the hawkish element of the committee. The tone from the Fed chair at the Wednesday press conference will matter greatly for markets and for expectations about September. The June Personal Consumption Expenditures (PCE) data, released Thursday morning, July 30, will provide additional guidance; cooler energy prices in June make a softer PCE print more likely, which would further reduce near-term hike probability.
The Story Most Investors Are Missing
Gold has held above the $4,000 level through thirteen consecutive nights of US strikes on Iran, oil spikes above $100 per barrel, and a period when market-implied September hike probability rose sharply. At several points when market forces might have pushed gold below that floor, it instead held.
Compare that behavior with earlier episodes, such as a ceasefire in April that sent gold higher in a single session. The more important takeaway is not only how gold reacts to positive developments, but that it resisted breaking lower when geopolitical risk and rate-tightening pressure were high.
A key structural factor behind this resilience is ongoing central bank buying. Central bank demand, particularly from major buyers, has continued through the conflict period: for example, the People’s Bank of China reportedly increased gold holdings over consecutive months through June 2026. That central-bank accumulation and related fiscal activity underpin a longer-term structural bullish case for gold that can offset cyclical headwinds driven by oil and short-term rate expectations.
For investors watching price direction, monitor September rate-hike probability via the CME FedWatch tool and the upcoming PCE release: those two indicators will likely shape gold’s next meaningful move.
Stay On Top of Gold & Silver Prices
Get concise market alerts delivered to your inbox.
Live price widget removed in this cleaned version.
To sign up for alerts, use the subscription form on the original site.
SOURCES
1. GoldSilver — Live Gold and Silver Spot Prices, July 27, 2026
2. Reuters via Business Recorder — Report on Iran halting attacks as long as the US does the same, July 27, 2026
3. Fox News — Confirmation of a pause in strikes; comments from US Ambassador, July 27, 2026
4. NBC News — Coverage of oil prices sliding after the pause in strikes, July 27, 2026
5. Saxo Bank — Market quick take on oil and Fed focus, July 27, 2026
6. CME Group — FedWatch Tool, FOMC rate probabilities, July 2026
7. Federal Reserve — FOMC statement and minutes, June 16–17, 2026
8. CNBC — Coverage of rising Fed odds as oil surged, July 23, 2026
9. FXStreet — Silver price and gold/silver ratio data, July 27, 2026
10. House of Commons Library — Research briefing on US-Iran ceasefire and talks in 2026
11. Silver Institute — World Silver Survey 2026 (Metals Focus)
12. Bureau of Economic Analysis — PCE Price Index release schedule (July 30, 2026)
Disclaimer: This article is for informational purposes only and does not constitute financial or investment advice. Consult a qualified financial adviser before making investment decisions.
You May Also Like:
- Silver Price Dynamics After an Oil Spike: Why Physical Buyers Changed Course
- Newmont’s Q2 Results: How a $2.2 Billion Quarter Traded Against Falling Gold Prices
- US Gold Reserves: Why Book Values Differ from Market Value
- What Recent Jobless Claims Mean for Gold
- How a Regional Escalation into a New Shipping Lane Affected Gold and Oil
- What Around-the-Clock Gold Trading Could Mean for Markets
Popular Topics
Picked from the archive
-
01
 Topics
Gold Remonetization: 6 Forces Reviving Gold as Money
-
02
Topics
CPI 3.3% and GDP Stalling: Is 2026 Stagflation Coming?
-
03
Topics
Why Is Gold Falling While War Rages?
-
04
Topics
Can Silver Outpace Gold in a Bull Market?
-
05
Topics
Gold Radar: 5 Hidden Signals Your Price Chart Misses
-
06
Topics
Gold Pullback Driven by Treasury Buyback, Not ETFs
-
07
Topics
Hong Kong Completes First Gold Settlement; Banks Also Run London
-
08
Topics
How a Falling Gold/Silver Ratio Impacts Investor Portfolios