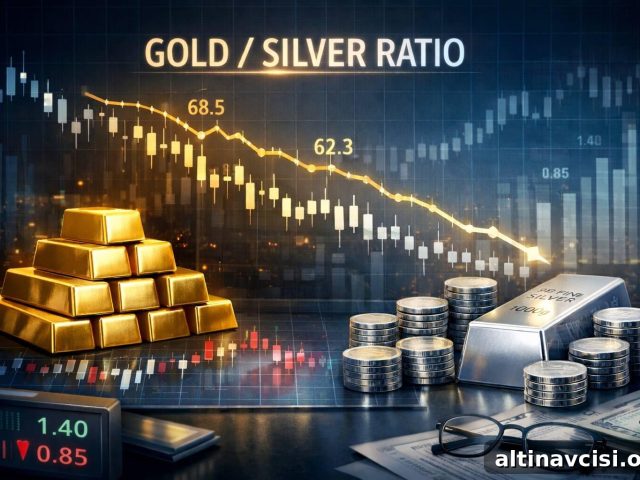
Physical Precious Metals to Buy During a Market Correction
Key Takeaways
- A price correction alone does not guarantee a bargain. High dealer premiums over spot can negate or exceed the apparent discount, so product selection matters as much as timing.
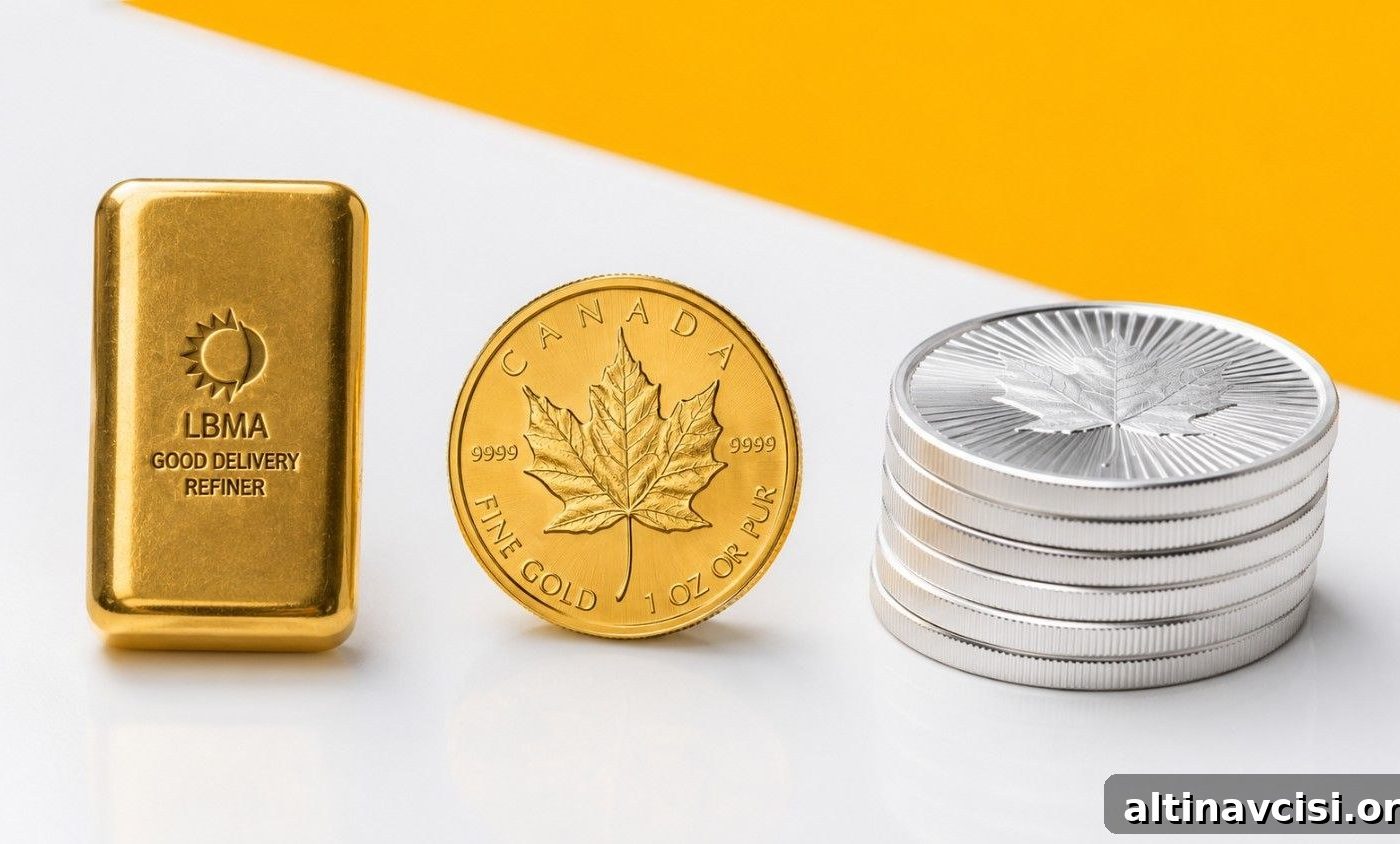
- Gold bars from LBMA Good Delivery-accredited refiners typically have the lowest premiums (about 1.5–3% over spot for a 1 oz bar), making them the most efficient way to accumulate gold ounces during a dip.
- Sovereign bullion coins — American Gold Eagles, Canadian Maple Leafs, Krugerrands, and Austrian Philharmonics — usually carry slightly higher premiums (roughly 3–7% per ounce) but provide the deepest global liquidity for quick resale.
- Silver’s higher base premiums change the value equation. Generic rounds from established private mints are the best value for buyers on a budget, while larger bars (10–100 oz) lower per-ounce costs for aggressive stackers.
- Avoid fractional gold, numismatic coins, and jewelry during a correction. These formats carry structural markups that compound on dealer premiums and reduce the metal received per dollar.
Price corrections separate informed buyers from those who act on instinct alone. When gold fell roughly 27% from its January 2026 intraday high and silver dropped more than 52% from its record, the instinct to buy more metal was sound. Too many buyers, however, missed the decisive detail: what to buy. A 10% drop in spot accompanied by sharply wider premiums can leave you paying the same or more per ounce than before the correction.
Retail demand typically spikes during corrections, depleting dealer inventory and pushing premiums higher. Premiums are the markup you pay above the published spot price and include fabrication, packaging, insurance, and dealer margin. The central question for physical metal buyers is: which product gives me the most ounces per dollar spent?
Typical retail dealer premium ranges (mid‑2026). Premiums widen during demand spikes.
Range to high
- 1 kg Gold Bar (LBMA): 1–2%
- 1 oz Gold Bar (LBMA): 1.5–3%
- Krugerrand / Philharmonic: 3–5%
- Canadian Maple Leaf: 3–5%
- American Gold Eagle: 4–7%
- Silver Bars (10–100 oz): 3–8%
- Silver Rounds (generic): 5–10%
- Fractional Gold (1/10 oz): 8–15%
- Sovereign Silver Coins: 15–20%
- American Silver Eagle: 15–25%
Note: these ranges reflect normal conditions; premiums can spike dramatically during demand surges.
Source summary: industry premium trackers and market observations (mid‑2026).
What Is the Difference Between Spot Price and the Price You Actually Pay?
The spot price represents the wholesale market rate for immediate delivery of large standardized contracts traded between institutions and bullion banks. Retail buyers do not transact in those contracts directly. When you purchase a 1 oz coin or a 10 oz bar, refiners and dealers add costs for minting, assaying, packaging, shipping, insurance, and distribution overhead. That combined markup over spot is the premium. No physical bullion product is sold at spot; the question is how large the premium is.
In routine markets, a 1 oz gold bar from a reputable refiner often carries a premium around 1.5–3% over spot, while common gold coins range about 3–7%. Silver premiums are higher in percentage terms because fabrication costs are similar in dollar terms to gold, but silver’s lower per‑ounce price makes those costs a larger share of the final price. Average sovereign silver coin premiums often sit near 15–25%, while silver bars and rounds can compress to roughly 5–10%.
The Knowledge That Changes Everything

Two essential guides — free. Learn why gold matters and why fiat currencies erode purchasing power over time.
Request the guides directly from the provider on their site.
Are Gold Bars or Gold Coins Better to Buy During a Correction?
Both formats have valid roles. The choice depends on whether you prioritize cost efficiency (more ounces per dollar) or resale liquidity (ease of selling quickly). Below are the main tradeoffs.
Gold Bars: Maximum Ounces Per Dollar
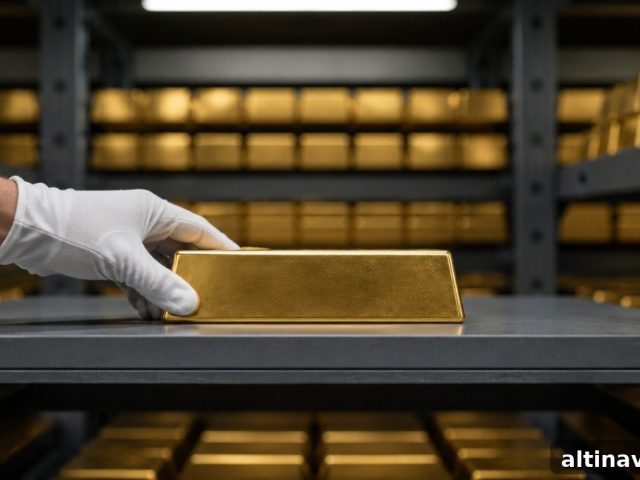
Gold bars from LBMA Good Delivery-accredited refiners typically carry the lowest premiums because they avoid government minting surcharges and many anti‑counterfeiting brand premiums. A 1 oz bar from recognized refiners commonly has a premium of about 1.5–3% over spot; larger bars (10 oz and 1 kg) often compress per‑ounce costs further, with 1 kg bars frequently near 1–2% over spot. If your goal is to maximize ounces during a correction, start with bars from accredited refiners and favor sealed assay packaging to facilitate resale.
Sovereign Bullion Coins: Deepest Liquidity, Slightly Higher Cost
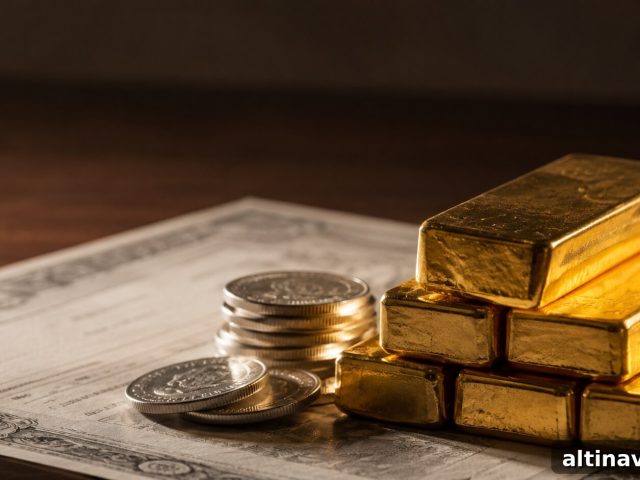
Government-minted coins typically carry premiums around 3–7% over spot. That extra cost buys global recognition, standardized legal‑tender weights, and simpler authentication at point of sale. Canadian Maple Leafs and Krugerrands often provide some of the lowest sovereign premiums (frequently 3–5%), while American Gold Eagles carry somewhat higher domestic premiums (commonly 4–7%) because of strong U.S. demand. Sovereign coins are the easiest to sell quickly almost anywhere in the world.
What to Avoid: Fractional Gold
Fractional gold coins (1/4 oz, 1/10 oz) have much higher premiums — often 8–15% or more — because minting costs are similar regardless of size but divided across less metal. During corrections these premiums can spike further. If your objective is maximum metal per dollar, avoid fractional gold in favor of whole-ounce coins, small bars, or, for lower budgets, generic silver rounds.
What Silver Products Have the Lowest Premiums?
Silver premiums are higher in percentage terms than gold. To manage silver cost, choose formats that minimize fabrication and distribution costs per ounce.
Silver Bars: Lowest Per-Ounce Premium for Stacking
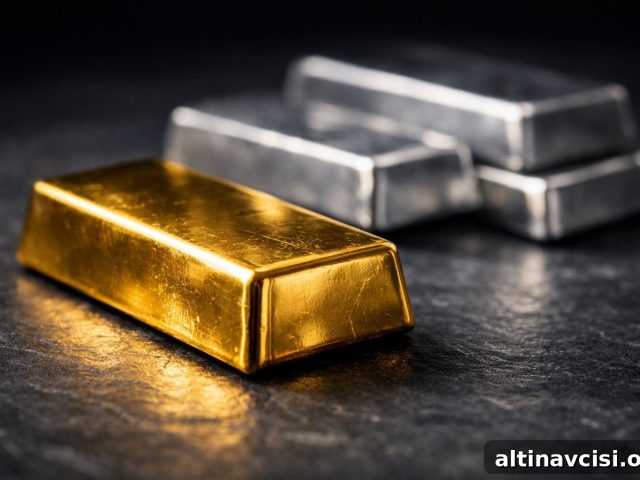
Large-format silver bars (10–100 oz) from established refiners offer the lowest per-ounce premiums. A 100 oz cast bar typically delivers a substantially lower per-ounce price than most coins or rounds. The tradeoff is storage and resale flexibility: large bars require secure storage and finding a buyer for the full unit when you sell.
Generic Silver Rounds: Best Balance of Price and Flexibility
Generic silver rounds (.999 fine) from reputable private mints often run about 5–10% over spot — materially lower than the 15–25% premiums seen on many sovereign silver coins. Rounds are divisible, widely recognized, and easier to sell in smaller amounts, making them the preferred option for many stacking strategies that prioritize both price efficiency and flexibility.
Sovereign Silver Coins: Pay Up for Liquidity
Sovereign silver coins (American Silver Eagle, Canadian Silver Maple Leaf, Austrian Philharmonic, British Britannia) provide instant dealer recognition and deep resale liquidity, but at a higher premium. If you need silver as a highly convertible asset, the added cost can be worth it; for strict cost efficiency in a dip, rounds or large bars are usually the better choice.
Which Physical Precious Metals Should I Avoid During a Correction?
Three categories typically underperform for buyers who act during corrections:
Numismatic and Rare Coins
Collectible coins derive value from rarity, condition, and collector demand — not metal content. Their prices do not track spot reliably. During a market correction, stick to bullion coins traded close to metal value rather than numismatic pieces.
Jewelry
Jewelry includes design markups, retail margins, and often sales tax. Resale usually yields only melt value after refining costs, which makes jewelry an inefficient form of bullion ownership during corrections.
Fractional Gold Coins in High-Demand Conditions
Fractional coins not only carry higher base premiums, they also become scarce faster in demand spikes, driving premiums even higher. If budget limits prevent a full-ounce purchase, consider generic silver rounds for better metal-per-dollar value.
How Do I Calculate Whether I’m Getting a Fair Price?
To calculate premium: get the current live spot price, subtract it from the dealer’s asking price, and divide the difference by the spot price. The result is the premium percentage. For example, if spot is $4,042 and a 1 oz Eagle is $4,285, the premium is ($4,285 − $4,042) / $4,042 ≈ 6.0%. If premiums exceed typical ranges for the product (e.g., above ~8% for many gold products or above ~20% for silver sovereign coins), compare other dealers or switch to a lower-premium format.
Buy From Refiners With Established Resale Liquidity
Prefer bars from recognized LBMA Good Delivery refiners and rounds from established private mints with visible secondary-market circulation. Those stamps and reputations reduce the buyer’s need to assay on resale and minimize friction when converting metal back to cash.
What Is the Sound Money Case for Buying Physical Metal During a Correction?
Why the Structural Case Survives a Price Drop
Corrections are normal and often driven by short-term factors like policy shifts or profit-taking. The long-term structural drivers that support precious metals — central-bank buying, persistent supply constraints in some markets, and the erosion of fiat purchasing power — do not vanish simply because spot prices fall. Buying physical metal during a dip can increase the ounces you own if you minimize premiums and select the right products.
The Constraint: Premium Management
The benefit of buying during a correction only materializes if you keep premiums low. Verify the refiner, confirm live spot before you transact, and choose formats that maximize metal per dollar so the correction’s price advantage actually translates into more ounces in your possession.
Stay On Top of Gold & Silver Prices
Receive market alerts and updates by subscribing to the publisher’s newsletter directly on their site.
People Also Ask
Yes. In the U.S., physical gold and silver are classified as collectibles for tax purposes. Long-term capital gains on collectibles are taxed at a maximum rate of 28%, higher than the typical long-term capital gains rates for other investments. Short-term gains (held under one year) are taxed as ordinary income. Keep accurate records of purchase dates, prices, and premiums to establish your cost basis.
It depends on your objectives. Gold tends to be lower volatility with tighter relative premiums and deeper institutional liquidity. Silver offers more ounces per dollar but has higher structural premiums and greater price swings. Many investors hold both, using large-format silver or rounds for cost efficiency and sovereign gold coins for liquidity.
Yes. Premiums can surge during demand spikes. Historical episodes (for example, demand surges in 2020) saw American Silver Eagle premiums exceed 40% over spot briefly. A drop in spot combined with sharply higher premiums can result in paying more per ounce than before the correction.
Staggering purchases (dollar‑cost averaging) reduces the chance of buying at a temporary bottom. Spreading purchases across two or three tranches balances capturing lower prices and avoiding mistimed buys. Multiple small purchases can incur higher per-unit premiums, so weigh the tradeoff between timing risk and cost efficiency.
For sealed bars from reputable LBMA-accredited refiners, the tamper-evident assay card is a primary verification. For secondary-market bars outside original packaging, common non‑destructive tools include electronic metal verifiers and precision scales. A magnet test can identify some fakes but does not confirm purity. Avoid sellers who cannot provide provenance documentation.
SOURCES
1. GoldSilver — industry guides on spot vs premium and bullion comparisons (June–April 2026).
2. LBMA — Good Delivery and accredited refiners list.
3. MetalCharts — bullion coin premium tracking (May 2026).
4. FindBullionPrices — live premium tracker (July 2026).
5. MintedMetal — coin recommendations (April 2026).
6. World Gold Council — central bank demand data (2025).
7. Silver Institute — World Silver Survey 2026 (2025 annual data).
8. U.S. Treasury Fiscal Data — federal interest payment data (accessed July 2026).
Disclaimer: This article is for informational purposes only and does not constitute financial or investment advice. Consult a qualified financial adviser before making investment decisions.
You May Also Like:
- Gold Is Down 26%. Silver Is Down 51%. What Does the Stacker Do Now?
- Gold Allocation Calculator: How Much Should Your Portfolio Actually Hold?
- What Is the Gold Volatility Index (GVZ) — and What Does It Mean for You?
- Gold & Silver Market Correction: Is the 2026 Bull Market Over?
- JPMorgan Cut Its Gold Forecast by 25%. Here’s What Long-Term Holders Need to Know.
- Why HSBC Still Believes Gold Hits $4,750 by Year‑End (And What the Mainstream Is Missing)
- State Street Predicts $5,500 Gold by Q1 2027: Is the Dip Over?
Popular Topics
Picked from the archive
-
01
 Topics
Gold Remonetization: 6 Forces Reviving Gold as Money
-
02
Topics
CPI 3.3% and GDP Stalling: Is 2026 Stagflation Coming?
-
03
Topics
Why Is Gold Falling While War Rages?
-
04
Topics
Can Silver Outpace Gold in a Bull Market?
-
05
Topics
Gold Radar: 5 Hidden Signals Your Price Chart Misses
-
06
Topics
Gold Pullback Driven by Treasury Buyback, Not ETFs
-
07
Topics
Hong Kong Completes First Gold Settlement; Banks Also Run London
-
08
Topics
How a Falling Gold/Silver Ratio Impacts Investor Portfolios