Gold Volatility Index (GVZ): What It Means for Investors
Key Takeaways
- The gold volatility index (GVZ), published by Cboe Global Markets, measures the market’s expectation of 30‑day price movement in gold using options on the SPDR Gold Shares ETF (GLD).
- A GVZ reading of 25 implies options traders expect gold to move roughly 25% on an annualized basis over the next 30 days.
- GVZ spikes during both crises and bull markets — for example, the 2008 financial crash peaked around 64.53 and the COVID-19 shock reached 48.98; during gold’s all‑time high week in January 2026 GVZ climbed above 46.
- Rising GVZ in a bull market often reflects increased demand for upside call options from institutional buyers hedging or seeking further gains, rather than panic selling.
- For long‑term physical gold holders, a high GVZ is not a direct threat: it reflects activity in the paper options market and not the intrinsic qualities of allocated physical bullion.
If you follow gold markets, you have probably seen references to the gold volatility index, or GVZ. Seeing GVZ rise into the 30s or 40s can cause unease: does a high GVZ mean you should act? The short answer is: not necessarily. Below is a clear, practical guide to what GVZ measures, how to interpret its levels, and what the index means for investors who own physical gold.
What Is the Gold Volatility Index (GVZ)?
GVZ is a real‑time index created by Cboe Global Markets that estimates how much the market expects the price of gold to fluctuate over the next 30 days. It is calculated from option prices on the SPDR Gold Shares ETF (GLD). Because option premiums rise when traders expect bigger price moves, higher option prices translate into a higher GVZ. The index is expressed as an annualized percentage: a GVZ of 15 indicates the market expects roughly 15% volatility on an annualized basis over the coming month; a GVZ of 35 implies much larger expected swings.
The Knowledge That Changes Everything
Two essential guides — yours free. Understand why gold matters and why fiat currencies tend to fail over time.
How Is the GVZ Different From the VIX?
The VIX measures expected volatility for the S&P 500. GVZ uses the same mathematical framework applied to gold via GLD options, so both indices are forward‑looking and express implied volatility in annualized percentage terms. The key difference is their economic signals: the VIX is widely treated as a fear gauge for equities, while GVZ reflects the unique drivers of gold — changes in monetary confidence, real interest rates, and geopolitical risk. As a result, GVZ can rise for reasons unrelated to panic about a gold price decline.
What Do Different GVZ Levels Mean for Investors?
Historical data from the Federal Reserve Bank of St. Louis (FRED), which archives GVZ, shows useful regimes to guide interpretation:
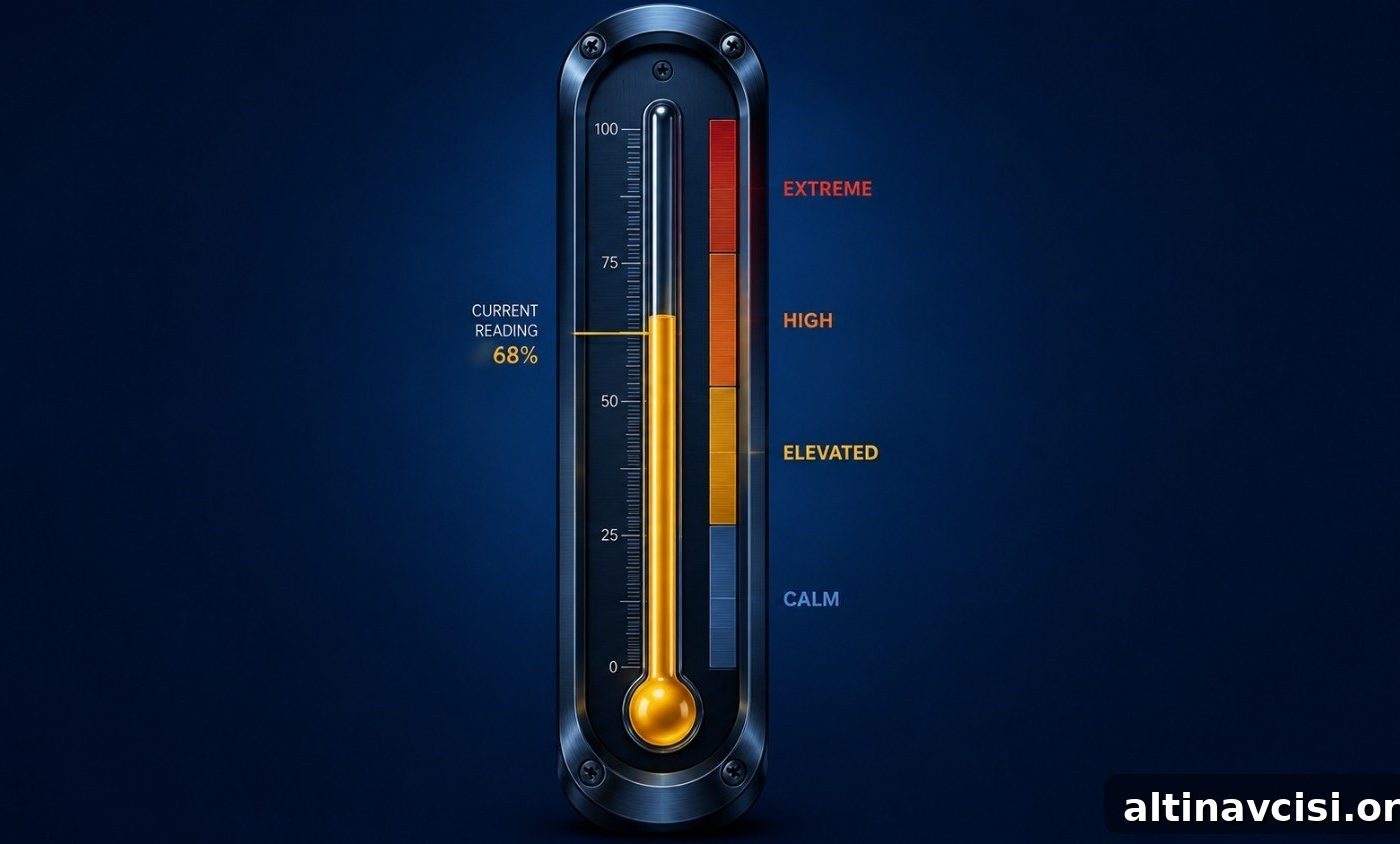
Below 15 — Exceptionally calm: Readings below 15 reflect an options market that expects limited movement. Periods of unusually low GVZ have often preceded directional breaks in price because calm markets can suddenly shift.
15–20 — Normal baseline: This range was common in relatively stable macro periods. It indicates moderate, orderly market conditions.
20–30 — Elevated: Above 20 suggests traders anticipate meaningful moves. This can reflect a developing bull market in gold, geopolitical uncertainty, or upcoming major economic events.
30–50 — High: Readings in this band usually accompany a macro shift or significant market stress and often coincide with rapid price moves.
Above 50 — Extreme: These are crisis readings driven by systemic stress and have appeared during major shocks to liquidity and markets.
Chart removed — historical monthly GVZ averages have shown clear spikes during crisis periods (2008, March 2020) and also during major gold bull markets (January 2026).
Source: FRED (Federal Reserve Bank of St. Louis) and historical price archives. Monthly averages referenced for context.
Why Did the GVZ Spike When Gold Hit Its All‑Time High?
A high GVZ during a gold bull run can seem counterintuitive, but the index measures expected magnitude of moves, not direction. When gold rallied to record highs, GVZ rose because institutional demand for upside call options surged. Portfolio managers and institutional buyers were buying optional exposure to further gains — effectively paying for the right to participate if prices continued higher. That buying pressure raises option prices and pushes implied volatility up.
By contrast, GVZ spikes in crisis moments are often driven by put buying as market participants seek downside protection or are forced to liquidate positions. Both scenarios raise GVZ, yet they convey different market structure: bull‑market surges reflect optimism and positioning for more upside, while crisis spikes reflect fear of downside risk. Context matters when interpreting the cause and implications of any GVZ spike.
Does the GVZ Predict the Direction of Gold Prices?
No. GVZ indicates expected volatility — how far prices may move — not whether they will move up or down. Traders use GVZ to price options, manage hedges, and time trades, but using GVZ alone to forecast direction is unreliable. Think of GVZ like a wind speed forecast: it tells you how turbulent conditions might be, not whether it will rain or shine.
What Does the GVZ Mean for Long‑Term Physical Gold Holders?
GVZ is a paper‑market metric derived from options on an ETF. It reflects the behavior of traders managing short‑term positions and hedges. For owners of allocated, physical gold held in secure storage, daily GVZ readings are largely noise: your bars or coins remain intact and are not subject to margin calls or forced liquidation in the paper market.
That said, GVZ can be useful for timing and risk management. Persistently elevated GVZ signals a higher probability of large price swings ahead. Active buyers might respond by dollar‑cost averaging to spread risk across entry points rather than making a single large purchase. This approach recognizes that high volatility increases the randomness of any single purchase price.
Where Can You Track the GVZ Today?
GVZ is widely available through financial platforms under the symbol GVZ or ^GVZ in real‑time feeds. Historical daily series are archived by the Federal Reserve Bank of St. Louis (FRED), which is useful for long‑run context and regime analysis. Cboe also publishes related commodity volatility indices, such as the crude oil and silver ETF volatility indices, which help determine whether elevated gold volatility is isolated or part of a broader commodity shift.
What Does the GVZ Reveal About Gold’s Role in the Monetary System?
Beyond short‑term readings, a sustained elevation in GVZ can signal a structural change in how institutions view gold. From roughly 2015–2022, many professional managers underweighted gold and GVZ averaged in the mid‑to‑high teens. Starting around 2022 and accelerating through 2025–2026, central bank buying increased, real yields turned negative at times, and fiscal dynamics shifted. Those changes prompted institutional reengagement with gold and a structurally higher range for implied volatility.
For individual holders of physical gold, rising GVZ confirms that institutional attention has returned to the metal. For those who do not yet hold bullion, it signals that professional capital has already repositioned — a factor to consider when evaluating exposure and timing.
Stay On Top of Gold & Silver Prices
Get important market alerts sent straight to your inbox.
People Also Ask
GVZ is the ticker symbol for the Cboe Gold ETF Volatility Index. The “G” stands for gold, “V” for volatility, and “Z” is the exchange designation.
GVZ uses the same methodology as the VIX: it takes mid‑quote prices from near‑term GLD put and call options across many strike prices, interpolates to a constant 30‑day variance estimate, then converts that variance into an annualized volatility percentage.
No. Both measure implied volatility using similar math, but the VIX tracks S&P 500 options while GVZ tracks gold via GLD options. Their drivers and market implications differ accordingly.
Historically, readings below 15 are unusually calm, 15–20 is a baseline normal range, 20–30 is elevated, and 30+ signals significant expected movement. Recent 52‑week ranges have spanned roughly the mid‑teens to the high 40s during shocks.
A high GVZ measures expected volatility, not direction. For long‑term holders of allocated physical gold, GVZ is largely irrelevant to the metal’s long‑term purchasing power. High GVZ does not automatically mean you should sell; it simply signals greater short‑term price volatility.
SOURCES
1. Cboe Global Markets — CBOE Gold ETF Volatility Index (GVZ).
2. Federal Reserve Bank of St. Louis (FRED) — CBOE Gold ETF Volatility Index daily series.
3. Historical gold and silver price archives and market commentary for context.
Disclaimer: This article is for informational purposes only and does not constitute financial or investment advice. Consult a qualified financial adviser before making investment decisions.
You May Also Like:
- Gold & Silver Market Correction: Is the 2026 Bull Market Over?
- JPMorgan Cut Its Gold Forecast by 25%: What Long‑Term Holders Need to Know
- Why HSBC Still Believes Gold Hits $4,750 by Year‑End
- State Street Predicts $5,500 Gold by Q1 2027: Is the Dip Over?
- Why China’s Gold Buying Spree Outweighs India’s Pause
- What Is Purchasing Power — and How Gold Preserves It
- Why Hong Kong? Inside Offshore Gold Storage Networks
Popular Topics
Picked from the archive
-
01
 Topics
Gold Price Cycles Explained: A Four-Time-Horizon Framework
-
02
Topics
Gold Repricing Underway: 5 Major Institutions Confirm
-
03
Topics
How Dalio, Buffett and Jim Rogers Invest in Gold
-
04
Topics
How Gold Prices Move During a US Dollar Crash
-
05
Topics
5 Factors That Drive Gold Spot Prices
-
06
Topics
August CPI: Sticky Inflation Unlikely to Stop Fed Rate Cuts
-
07
Topics
Institutions Are Buying as Bond Yields Rise: What It Means
-
08
Topics
Why a Stalled Federal Reserve Matters for Gold Prices