Why Silver and Oil Are Rising Together and What It Means
Oil is up about 3% this morning. Under normal circumstances, that alone would typically push silver lower — and many traders understand why. Today, however, silver is moving the opposite way.
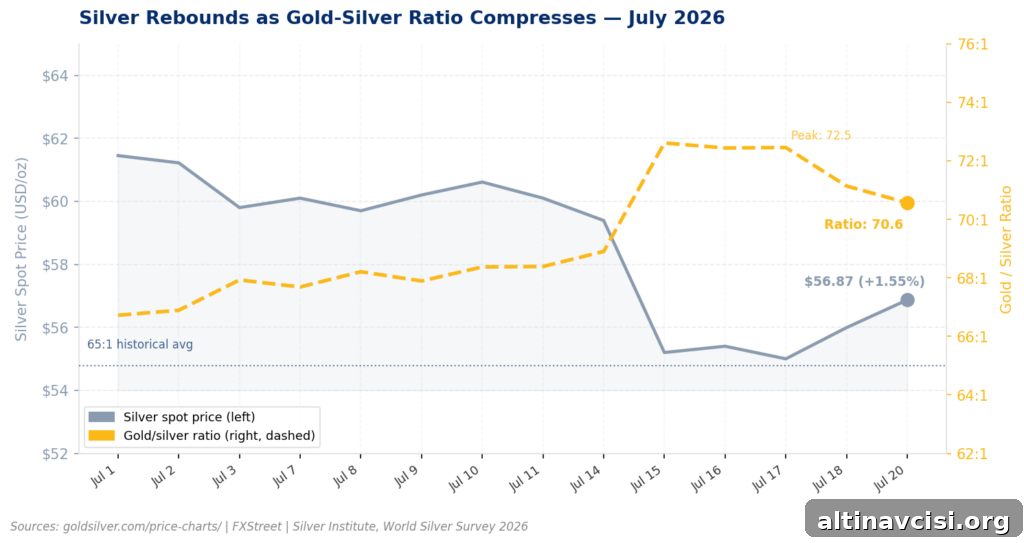
Silver’s spot price sits at $56.87, up roughly 1.55%, while gold is essentially flat near $4,013, off only about 0.15%. At the same time, WTI crude is trading near $85 a barrel (up roughly 2.5%) and Brent has pushed above $90. These divergent moves in commodities and precious metals are worth unpacking because the reasons behind them are more important than the price action itself.
Why Does Rising Oil Usually Push Silver Lower?
The typical chain works in four steps. First, oil spikes, often driven by geopolitical events — for example, the recent series of airstrikes and tensions in the Gulf. Second, higher oil feeds headline inflation. Third, rising inflation increases the odds that the Federal Reserve will raise interest rates. Fourth, a higher-rate outlook raises the opportunity cost of holding non-yielding assets like silver and weakens expectations for industrial growth, which directly reduces demand for the metal.
Silver is especially exposed to that fourth step because demand for silver splits roughly between two engines: industrial use and monetary/investment demand. About 58% of annual silver consumption goes to industrial applications — solar panels, electronics, EV components and similar uses — while the remaining 42% is monetary or investment-related. When rate anxiety rises, both demand engines are pressured at once. Gold, by contrast, is driven almost entirely by monetary demand, so it tends to hold up better when rate expectations change.
That dynamic explained most of July’s action: as airstrikes intensified and oil climbed, silver fell more than 7% last week. But today’s move shows a different interaction between oil, inflation expectations and rate pricing.

The Edge Every Investor Needs
Smarter precious metals investing starts here. The Nuggets newsletter delivers market insights, Fed updates, global trends, and educational content to help you stay informed.
What Changed Today? Why Is Silver Ignoring the Oil Spike?
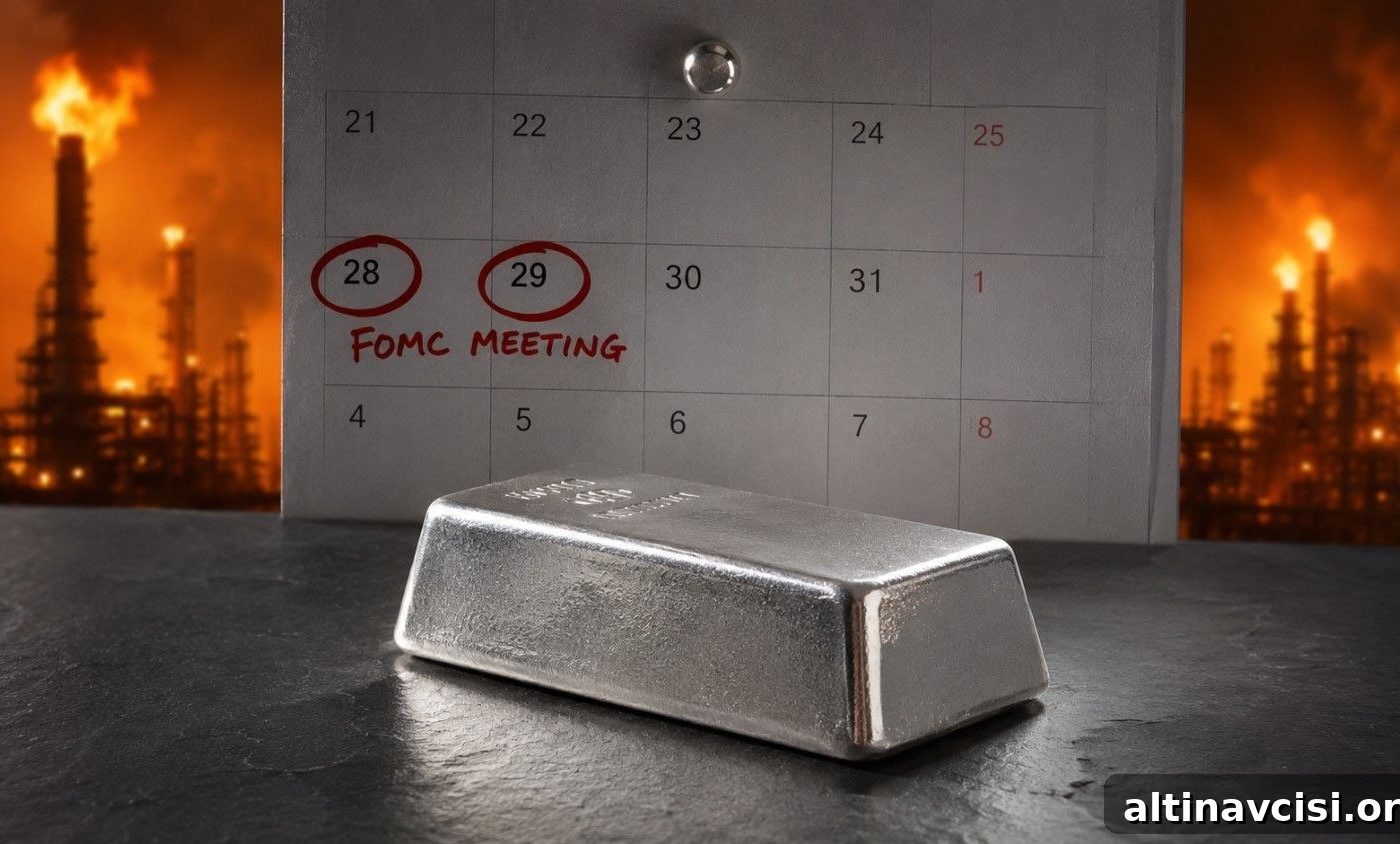
The key is what markets have already priced into the Federal Reserve’s next meeting. The FOMC meets on July 28–29, just days away, and as of the most recent data the market had priced a probability of a rate hold above 85%. That level of conviction effectively settles the July hike question: the market is largely treating July as a hold. In addition, June’s CPI reading came in at 3.5% year-over-year, down from May’s 4.2%, which is the data that helped lock in the expectation of no hike for July.
Because markets have already internalized the July outcome, a single day of higher crude prices doesn’t meaningfully change the Fed-rate calculus. That reduces the immediate transmission of oil-driven inflation into higher rate expectations and weakens the typical downside pressure on silver’s industrial demand. At the same time, the dollar is slightly weaker today despite the oil move, which helps silver’s monetary demand. The result is silver rising even as oil gains — not because inflation isn’t responding, but because markets have already processed the most important piece of the inflation narrative for July.
What Does the Gold-Silver Ratio Tell Us Right Now?
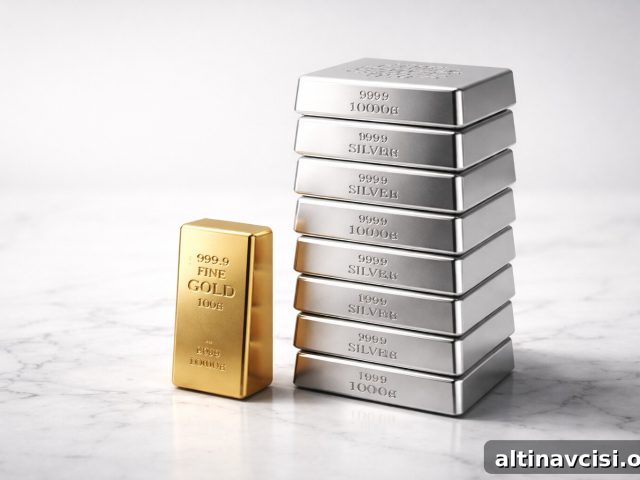
The gold-silver ratio — how many ounces of silver buy one ounce of gold — has been a reliable signal this year. It has contracted from recent highs, moving from about 71.77 on Friday to roughly 70.6 midday today. That compression reflects silver outperforming gold, which is what we expect when silver’s industrial engine begins to reactivate relative to its prior suppressed state.
For perspective, the ratio fell to about 55:1 in May before the Fed’s hawkish repricing in June and early July pushed it back toward 72. The long-term, fifty-year average sits near 65:1, so at current levels silver remains relatively inexpensive versus gold. The physical market supports that view: the World Silver Survey projects a sixth consecutive annual supply deficit for 2026, signaling structural tightness even as paper markets and rate anxiety have intermittently distorted prices.
What Should Long-Term Silver Holders Understand About Today’s Move?
Today’s divergence is a practical reminder that silver’s moves are not random. They follow a predictable interaction between monetary and industrial demand. When rate uncertainty weighs on both engines, silver underperforms. When rate clarity returns — as it appears to have for the July meeting — industrial demand can stabilize and silver can perform better even amid short-term oil-driven inflation spikes.
Still, the longer-term structural story remains intact. Consecutive years of supply deficits mean the physical market is steadily drawing down available stocks. That imbalance doesn’t resolve with a single Fed meeting; it responds to the cumulative effect of demand exceeding supply over months and years. Today’s session is not a decisive breakout, but it shows the limits of the suppression trade: when the rate question is resolved, physical fundamentals reassert themselves.
What to Watch Before the FOMC Decision
Two upcoming data points will shape silver’s near-term outlook. First, the FOMC decision on July 29: a hold is widely expected, but the Fed chair’s post-meeting remarks — and any signals about September — will drive market positioning. Any suggestion that a September hike is still on the table would likely push the gold-silver ratio higher again. Second, June’s PCE report arrives on July 30. PCE is the Fed’s preferred inflation gauge; a soft PCE print would reinforce the hold narrative and likely further compress the ratio, while a hotter-than-expected PCE could reopen rate-hike odds.
Geopolitical risk, especially tensions around Iran and shipping through the Strait of Hormuz, remains the main wildcard. Ongoing disruptions that keep oil prices elevated would sustain headline inflation and reduce the Fed’s flexibility, which in turn could prolong the period of rate anxiety and limit silver’s recovery. Nonetheless, geopolitical upside risks to prices are distinct from the long-run physical imbalance that has been building in silver markets.
SOURCES
1. GoldSilver — Live Silver Spot Price, July 20, 2026 (price charts)
2. GoldSilver — Live Gold Spot Price, July 20, 2026 (price charts)
3. Silver Institute / Metals Focus — World Silver Survey 2026 & sixth consecutive annual market deficit outlook, April 15, 2026
4. U.S. Bureau of Labor Statistics — Consumer Price Index Summary, June 2026
5. CME Group — FedWatch Tool, July 2026 FOMC hold probability, mid-July 2026
6. FXStreet — Silver price coverage, July 20, 2026
Disclaimer: This article is for informational purposes only and does not constitute financial or investment advice. Consult a qualified financial adviser before making investment decisions.
You May Also Like:
- Hong Kong Just Ran Its First Gold Settlement. The Banks Who Did It Also Run London’s.
- Consumer Inflation Expectations Just Fell to 4.2%. Gold Fell Too. The Survey Missed the Oil Spike.
- Gold Fell 3.4% This Week. The Long-Term Case Didn’t.
- Manufacturing Just Had Its Best Month of 2026. Gold Just Had One of Its Worst Days.
- Warsh Told Wall Street to Stop Watching the Fed. Gold Already Knew.
- Gold Falls as Retail Sales Confirm the Fed Has No Reason to Cut.
Popular Topics
Picked from the archive
-
01
 Topics
Gold Prices Rise for Seventh Week as Jobs Data Goes Dark
-
02
Topics
Gold Silver Ratio Forecast: Buy Gold, Add Silver or Wait?
-
03
Topics
Iran’s War Deadline Sparks Gold and Silver Price Volatility
-
04
Topics
Silver Breaks Above $92 as Citi Sees $100 by March
-
05
Topics
Gold vs Inflation: What 100 Years of Data Reveals
-
06
Topics
Why Central Banks Are Quietly Buying Gold
-
07
Topics
Inflation Holds at 3.0%, Gold Funds Post Historic Rally
-
08
Topics
Gold Prices: 5 Forces Investors Are Watching Now