State Street Sees $5,500 Gold Price by Q1 2027 — Is the Dip Over?

Key Takeaways
- State Street’s July 2026 Monthly Gold Monitor headline target is $5,000 per ounce by early 2027, with a 70% baseline scenario range of $4,750–$5,500, as stated by its SPDR Gold Strategy Team led by Aakash Doshi. [State Street Investment Management]
- The June correction — gold’s steepest quarterly drop since 2013 — was driven by rising real yields and a stronger dollar, not by a change in the structural case. [State Street Investment Management]
- Global debt hit a record $353 trillion in H1 2026, with government debt fast approaching one-third of that total, which continues to support gold as a monetary hedge. [State Street Investment Management]
- State Street’s bear scenario assigns a 25% probability to gold staying in the $4,000–$4,750 range if the Federal Reserve’s hawkish stance persists. [State Street Investment Management]
- Silver entered 2026 in its sixth consecutive year of supply deficit, with a cumulative drawdown of 762 million ounces since 2021. [Silver Institute] When gold approaches prior highs, silver’s high-beta behavior historically amplifies the move. [GoldSilver]
Gold reached an all-time high of $5,589 per ounce in January 2026. Six months later it traded near $4,100 — a roughly 27% decline and the steepest quarterly drop since 2013. That drop reflects tactical pressures; State Street’s July 2026 Monthly Gold Monitor focuses on the longer-term structural picture. The firm continues to target $5,000 per ounce into early 2027, with a 70% baseline probability that gold will trade between $4,750 and $5,500 over that period, grounded in the same structural factors that drove the January peak. [State Street Investment Management]
The real question is whether this correction signals a long-term shift or simply a pause within a larger upward trend. State Street treats the recent dip as a reset inside a sustained structural story rather than a fundamental reversal.
Why Did Gold Fall 27% from Its January High?
The decline was driven by a specific, measurable mechanism: higher real yields and a stronger dollar increased the opportunity cost of holding non-yielding assets like gold. When short-term and real interest rates rise, cash and Treasury instruments become more attractive, and gold often underperforms as investors rotate toward yield-bearing assets.
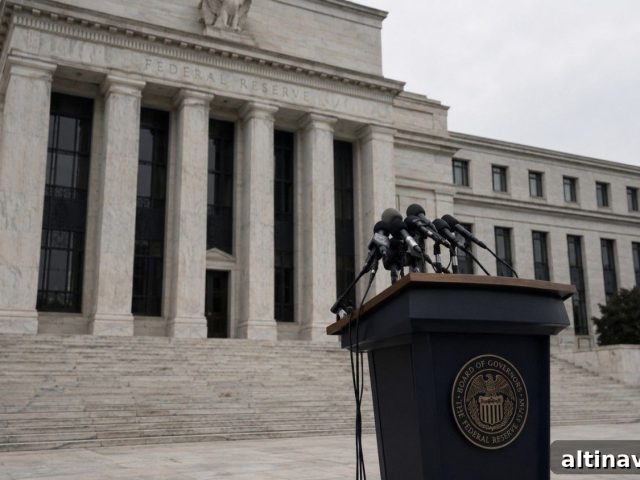
A sequence of events in early 2026 amplified that effect. Geopolitical tension between the US and Iran pushed energy prices higher, which fed through to inflation expectations and prompted the Federal Reserve to signal a hawkish stance. Markets priced in additional rate hikes, real yields rose, and US money market funds attracted record inflows as investors sought yield. Meanwhile, US-listed gold ETFs experienced significant outflows in June 2026. The dollar strengthened, and gold underperformed other G10 currencies over the March–June period. [State Street Investment Management]
Those tactical forces explain the sharp move, but they do not erase the structural reasons investors allocate to gold in the first place.
The Knowledge That Changes Everything

Two essential guides — yours free. Understand why gold matters and why fiat currencies historically weaken over time.
What Is State Street’s Structural Case for $5,000?
State Street’s July 2026 Monthly Gold Monitor begins with a clear assertion: a hawkish Federal Reserve in the near term should not upend the structural dynamics that have supported gold since the pandemic. Their outlook is built on three durable pillars.
First, record global debt. Total global debt rose to a record $353 trillion in the first half of 2026, with government debt now approaching one-third of the total. Rising government interest costs have made fiscal balances more sensitive to interest rates, which can create a longer-term tendency toward looser monetary settings than an inflation-free scenario would require. In that environment, gold’s role as a monetary hedge becomes more valuable. [State Street Investment Management]
Second, weaker stock-bond diversification. The long-standing inverse relationship between stocks and bonds that helped 60/40 portfolios for decades has broken down. With stock-bond correlations elevated relative to prior regimes, institutional allocators are seeking alternative diversifiers. Gold remains one of the few highly liquid assets that has offered genuine diversification in this new environment, supporting sustained institutional demand. [State Street Investment Management]
Third, persistent physical demand. Retail gold buying in China surged after geopolitical tensions, and emerging market central banks have continued to add to reserves during price dips rather than exit their positions. Central banks tend to follow long-duration reserve strategies, treating pullbacks as buying opportunities. For example, China’s central bank reported notable monthly additions in mid-2026, demonstrating ongoing demand that is less sensitive to short-term price swings. [GoldSilver]
Combining these forces, State Street assigns a 70% probability that gold will trade in the $4,750–$5,500 range by early 2027, with a headline target of $5,000 per ounce. [State Street Investment Management]
What Is the Bear Scenario?
State Street is explicit about downside risk. They place a 25% probability on gold remaining range-bound between $4,000 and $4,750 through Q1 2027. This outcome would require a persistently hawkish Fed, continued dollar strength, and elevated real yields — conditions that keep the opportunity cost of holding gold high. [State Street Investment Management]
Other forecasters have adjusted expectations similarly. For example, Goldman Sachs lowered its year-end 2026 target after accounting for ETF outflows and shifting expectations for rate cuts. According to Goldman’s analysis, each 50 basis points of Fed easing would add roughly $120 per ounce of support for gold, a factor now more likely to play out in 2027 than 2026. [GoldSilver]
State Street also identifies a deeper support band near $3,750–$4,000 as possible but assigns it lower probability, and gives only a small probability to a rapid bull move above $5,500. This is a probability-driven view, not an unconditional bullish call. [State Street Investment Management]
What Does State Street’s $5,000 Target Mean for Silver?
Silver tends to act as a higher-beta version of gold. It responds to the same monetary drivers — real yields, currency moves, central bank policy — and carries the added influence of industrial demand. Around 58% of global silver consumption is industrial, used in technologies from solar panels to electronics. [Silver Institute]
The silver market has been in deficit for several years; 2026 marked the sixth consecutive year of a supply shortfall, with cumulative drawdowns of on-hand stockpiles since 2021. [Silver Institute] Historically, when gold approaches previous highs, silver has amplified the move in percentage terms. The current gold-silver ratio, near the top of its long-term range, suggests room for silver to catch up if gold resumes an upward trajectory. [GoldSilver]
However, silver’s industrial exposure makes it more sensitive to a global manufacturing slowdown, and its higher volatility can work both for and against investors. Still, the structural setup — persistent deficits plus growing industrial demand — makes silver’s upside potential particularly notable if gold recovers toward the State Street baseline.
Is the Gold Dip Over?
Timing the market is always uncertain. What State Street’s assessment makes clear is that the structural case for gold remains intact despite the sharp correction. The June pullback was driven by identifiable tactical forces: a geopolitical shock that raised energy prices, higher inflation expectations, and a subsequent hawkish Fed response that pushed real yields up and drew capital into yield-bearing instruments.
Those tactical pressures can and will ease. The large, persistent structural factors — record global debt burdens, altered stock-bond correlations, and steady physical demand from major buyers — do not disappear because prices fell. Central bank purchases during the pullback indicate that long-term reserve managers saw the correction as an opportunity, not a signal to exit. [GoldSilver]
State Street’s $5,000 target is therefore best read as a probability-weighted assessment: the forces that pushed gold to record highs earlier in 2026 persist, the correction has created a lower entry point, and a recovery toward or beyond that level over the following six to nine months is more likely than not under their baseline scenario. In short, many professional investors view this correction as a setup rather than an ending.
Stay On Top of Gold & Silver Prices
Get important market alerts sent straight to your inbox.
People Also Ask
What is State Street’s gold price forecast for 2027?
State Street’s July 2026 Monthly Gold Monitor sets a headline target of $5,000 per ounce into early 2027 and assigns a 70% probability that gold will trade between $4,750 and $5,500 in that timeframe. The firm cites record global debt, elevated stock-bond correlations, and persistent physical demand — especially from China and emerging market central banks — as the main drivers. [State Street Investment Management]
Why did gold fall so sharply in mid-2026?
Gold’s sharp decline in mid-2026 resulted from rising real yields, a stronger dollar, and an uptick in Fed hawkishness after energy-price pressures tied to geopolitical events. Because gold pays no yield, higher interest rates raise the opportunity cost of holding it, which contributed to ETF outflows and institutional rebalancing. These factors were tactical and did not, according to State Street, invalidate the underlying structural case for gold. [State Street Investment Management]
What is the bear case for gold in 2026–2027?
State Street places a 25% probability on the scenario where gold remains range-bound between $4,000 and $4,750 through Q1 2027. That outcome would require the Fed to stay hawkish, the dollar to remain strong, and real yields to stay elevated — all of which keep non-yielding assets less attractive. Other analysts have similarly lowered near-term targets in response to ETF outflows and changed rate-cut expectations. [State Street Investment Management]
Why does a rising gold price matter for silver?
Silver follows the same monetary drivers as gold but typically shows higher volatility because of its industrial uses. With a multi-year supply deficit in silver markets and a gold-silver ratio near historical highs, a sustained gold rally could produce outsized percentage gains in silver as the ratio reverts. However, silver’s industrial demand also exposes it to manufacturing cycles, which can amplify downside risk. [Silver Institute] [GoldSilver]
Is now a good time to buy gold?
State Street’s analysis suggests the mid-2026 price environment represents an intermediate-term accumulation opportunity: they assign a 70% probability to a recovery toward $5,000 per ounce by early 2027. At the same time, a credible 25% bear-case probability exists if the Fed stays hawkish and real yields remain elevated. Individual decisions should reflect investment horizon, risk tolerance, and the role gold plays in a diversified portfolio. The structural case — fiscal imbalances, weakened stock-bond diversification, and steady physical demand — remains intact despite short-term volatility. [State Street Investment Management]
SOURCES
State Street Investment Management — Monthly Gold Monitor, July 2026
State Street Investment Management — Gold 2026 Midyear Outlook: A Tug-of-War Between Tactical and Structural Momentum
World Gold Council — Gold Mid-Year Outlook 2026: Point Break
GoldSilver — Gold Price Forecast 2026–2027: Key Predictions from Top Analysts
GoldSilver — Gold Price Outlook July 2026: The Price Fell. Case Intact.
Silver Institute — Global Silver Investment to Remain Strong in 2026 Against the Backdrop of a Sixth Consecutive Annual Market Deficit
GoldSilver — Silver Price Forecast 2026–2027: The Bull Case and Bear Case Laid Out
Disclaimer: This article is for informational purposes only and does not constitute financial or investment advice. Always consult a qualified financial adviser before making investment decisions.
You May Also Like:
- Why China’s Gold Buying Spree Outweighs India’s Pause
- What Is Purchasing Power — and Why Every Dollar You Save Is Slowly Being Taxed Away
- Why Hong Kong? Inside GoldSilver’s Offshore Gold Storage Network
- Silver Price Outlook July 2026: Two Catalysts, One Setup
- Why the 10-5-3 Rule Fails Gold and Silver Investors
- Why Is Silver So Hard to Mine? The Primary Supply Problem Explained
- Gold Price Outlook July 2026: The Price Fell. Case Intact.
Popular Topics
Picked from the archive
-
01
 Topics
Gold Rebounds as Asian Investors Drive Bullion Demand
-
02
Topics
Why Silver’s Price Floor Just Reset to $70
-
03
Topics
Federal Reserve Goes Silent: Why Gold Investors Don’t Need It
-
04
Topics
Silver Price Jumps 7% as Bulls Gain Momentum
-
05
Topics
July 29 Fed Meeting: Gold Priced In, Silver Diverges
-
06
Topics
Iran Hits Mediator’s Tanker; Gold Drops; Funeral Ends Thursday
-
07
Topics
Gold Jumps 1% – Why July CPI Matters More Than the Headline
-
08
Topics
Banks Forecast Gold Over $5,400 After Greenland News