Why Gold and Silver Climbed Despite Multiple Bearish Catalysts
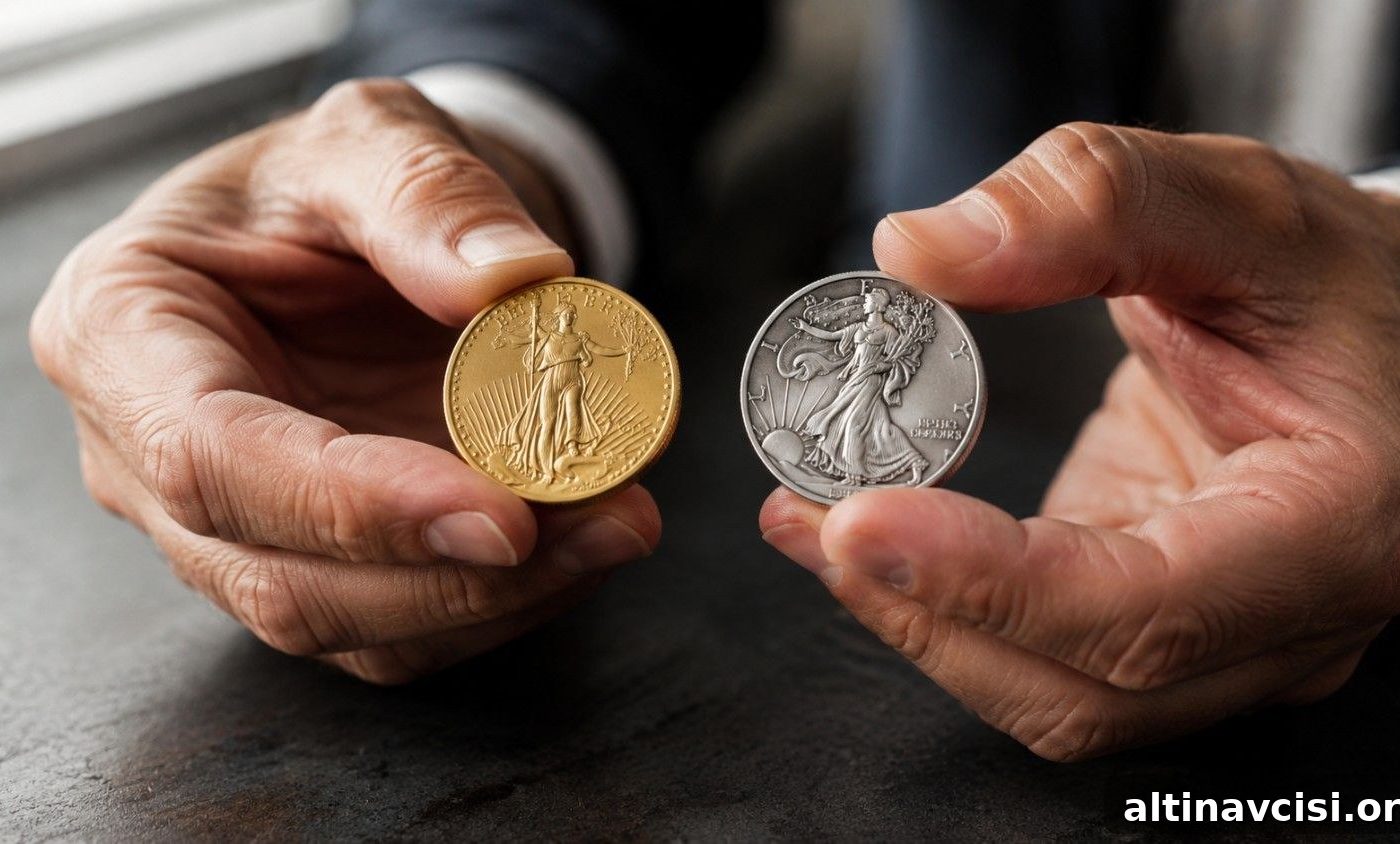
Gold and silver swung sharply on Thursday: both opened lower, then rallied later in the session despite a day when every bearish factor seemed to converge. The market digested a hotter-than-expected Producer Price Index, a surprise ECB rate hike, and renewed military clashes — yet both metals recovered from session lows to close higher.
The May Producer Price Index rose 6.5% year-over-year, the strongest wholesale inflation reading since November 2022 and slightly above consensus. Much of that increase reflected energy costs after disruptions related to the Strait of Hormuz. At the same time, the European Central Bank raised its policy rate 25 basis points to 2.25% — its first hike since September 2023 — and reported higher inflation and slower growth forecasts for the eurozone. On the geopolitical front, US and Iranian forces engaged again for a second consecutive night; Iran asserted the Strait was fully closed while US Central Command disputed that claim.
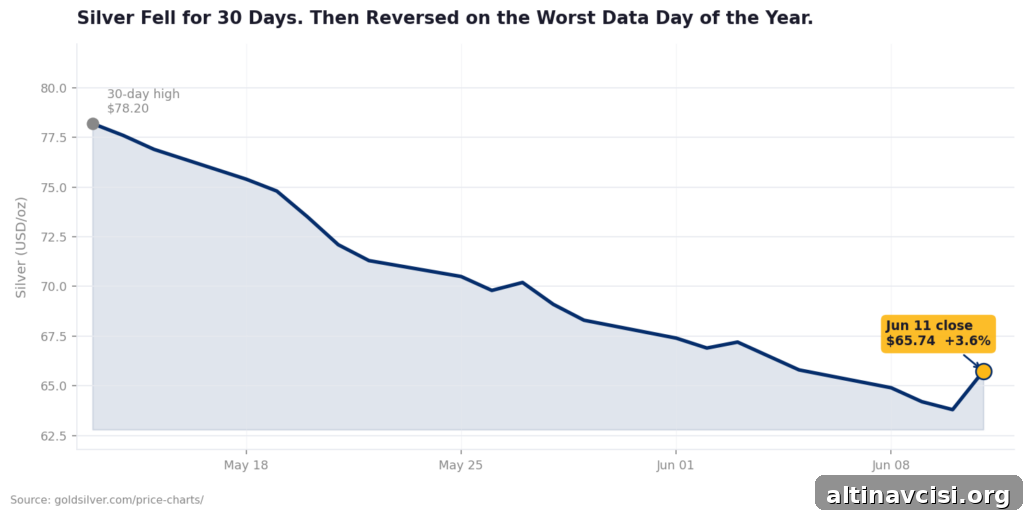
In early trading, gold fell to a session low near $4,023 and silver opened near $63.52, its weakest since December 2025. By mid-afternoon both metals reversed course: silver rallied from a low of $61.49 to finish the day up more than 3.5%, while gold climbed back toward $4,133 as reports said US strikes had concluded, reviving hopes for de-escalation and diplomacy.
What Does It Mean When Silver Holds on the Worst Data Day of the Year?
Silver had been sold for five straight sessions as traders positioned ahead of weak economic data. When the PPI arrived and matched those expectations, there was little left to trigger additional selling — a classic case of seller exhaustion. Prices briefly hit intraday lows before buyers emerged, pushing silver up more than 3.5% by the close. Gold followed a similar path, rallying after military officials signaled an end to immediate strikes and the possibility of talks.
Seller exhaustion occurs when negative information is already reflected in prices. Once that pessimism is exhausted, markets need a fresh catalyst to determine the next direction. In this instance, that catalyst could arrive with upcoming central bank guidance and geopolitical developments in the days ahead.
Why Did the ECB Hike — and What Does It Mean for Gold?
The ECB’s decision to raise rates after a long pause matters more than many headlines suggested. The bank raised its inflation forecast for 2026 while trimming its growth outlook, explicitly linking the deterioration to energy disruptions tied to the regional conflict. In plain terms, that is stagflation: rising prices with weakening growth.
An ECB rate rise does two things for precious metals. First, it can strengthen the euro relative to the dollar, which tends to lower the dollar index over time; a softer dollar generally supports dollar-priced gold. Second, it signals that major central banks are tightening policy in response to a supply-driven price shock they cannot control. That shifts the narrative from a U.S.-centric inflation story to a global monetary challenge — central banks tightening into inflation they did not create. Those are the conditions in which gold and silver historically perform well.
What Does Core PPI Tell Us That the Headline Doesn’t?
The 6.5% PPI headline is attention-grabbing, but the Fed focuses more on core measures that exclude volatile food and energy prices. Core PPI for May was lower than consensus at 4.9%, indicating that much of the headline increase was concentrated in energy. In other words, headline inflation is being driven by an external oil shock rather than a broad pickup in wages, services, or shelter costs. That distinction matters because it reduces the urgency of a Fed rate response in the absence of broader inflationary pressures.
What Should Physical Holders Watch Before the FOMC?
Central bank buying of gold has remained strong: institutions continued to accumulate bullion through the recent correction. Supply-side dynamics in silver also remain supportive, with industry estimates pointing to ongoing market deficits driven in part by industrial demand such as solar panels, electric vehicles, and AI infrastructure.
The Federal Reserve’s upcoming guidance is the primary near-term event for markets. The policy decision itself is widely expected to be a hold, but the Fed’s dot plot — showing projected interest rates over the coming years — will be closely scrutinized. If the projection includes a further hike later this year, that could pressure precious metals; if it leaves room for cuts should the geopolitical situation ease, that would be supportive. Recent ceasefire or de-escalation signals have sparked rapid gold rallies — one such announcement moved gold roughly $110 higher within hours — and that dynamic remains in play.
For physical holders, the thesis is unchanged: bullion serves as both a hedge against prolonged inflation from a sustained conflict and a beneficiary of monetary tailwinds if tensions ease. Short-term price swings matter for timing, but they do not alter the fundamental case for owning a non‑fiat, finite asset.
SOURCES
1. GoldSilver.com — Price Charts
2. U.S. Bureau of Labor Statistics — Producer Price Indexes, May 2026
3. European Central Bank — Monetary Policy Decisions, June 11, 2026
4. CME Group — FedWatch Tool
5. World Gold Council — Gold Demand Trends Q1 2026
6. The Silver Institute — World Silver Survey 2026
7. U.S. Central Command — Press Releases
8. U.S. Department of Labor — Unemployment Insurance Weekly Claims
Disclaimer: This article is for informational purposes only and does not constitute financial or investment advice. Always consult a qualified financial adviser before making investment decisions.
You May Also Like:
- Gold at Seven-Month Lows: Why Geopolitical Fear Is Not Enough
- Gold Slides to $4,130 as Iran War Turns Inflation Against It
- May CPI Printed 4.2%. Core Inflation Beat. So Why Did the Gold Price Drop?
- Gold Is Down 9%. The CPI Print That Could Either Extend the Drop — or End It.
- Gold Price News: Goldman, China, CPI, and the Fed Explained
- Gold Near $4,330 as Rate-Hike Bets Hit 70% and China Acts
- Gold Is Down 22% — The Same Drop as 2022. The Floor Is Not the Same.
- Silver Falls 6% on Jobs Beat. The Six-Year Deficit Didn’t.
- Gold Rate Hike Fears Are Weighing on Prices. Here’s the Full Picture.
Popular Topics
Picked from the archive
-
01
 Topics
Why Silver Dropped 3.3% vs Gold’s 1.6%: The Gap Explained
-
02
Topics
Banks Forecast Gold Over $5,400 After Greenland News
-
03
Topics
How Much Gold Does It Take to Buy a House?
-
04
Topics
How to Buy Gold in 2026: A Step-by-Step Guide for New Investors
-
05
Topics
Gold’s Center of Gravity Shifted East: 5 Stories That Prove It
-
06
Topics
1 Trillion Added to Debt: How It Could Move Gold Prices
-
07
Topics
Silver Jewelry vs Silver Bullion: A Buyer’s Guide
-
08
Topics
Fed Study: 5 Countries Cashed In on Gold Reserves in 30 Years