Why Fed Rate Hike Odds Reached 85% and Gold Climbed
KEY TAKEAWAYS
- April JOLTS reported 7.62 million job openings, nearly 750,000 above consensus.
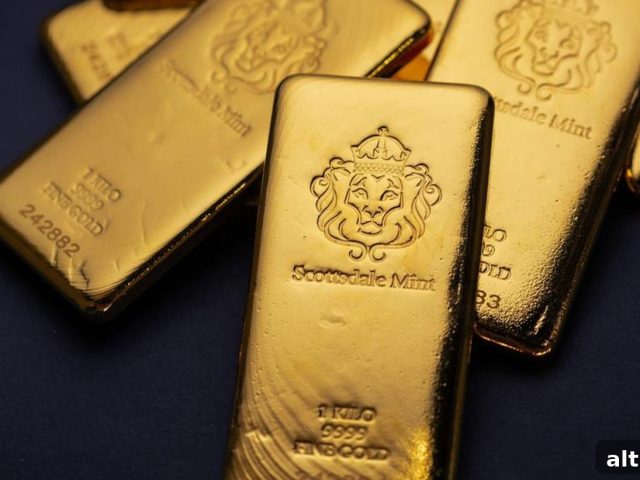
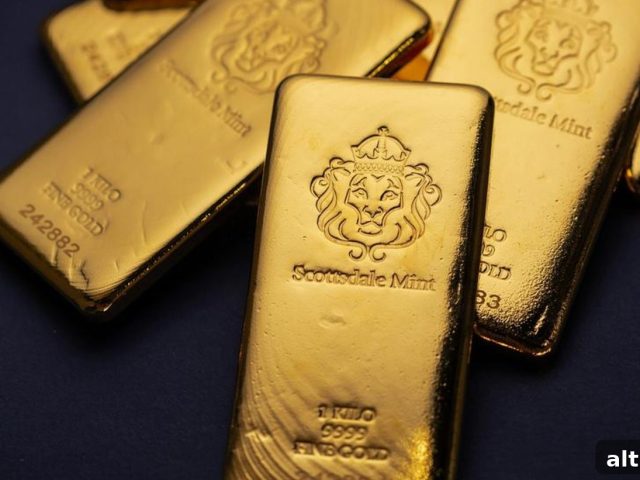
- Gold rose about $43 today to roughly $4,477/oz, defying the usual rate-hike reaction.
- CME FedWatch shows an 85% chance of a rate hike by December 2026, up from 60% a week earlier.
- In stagflationary environments, rising nominal rates can signal policy failure—bullish for gold.
- History shows gold climbed during the 1970s even as the Fed sharply raised rates.
- Only a Volcker-style surge in real rates (+4% or more) ended that prior gold bull market—today’s fiscal situation makes that unlikely.
- Monthly jobs reports move markets in the short term, but the real-yield dynamic supports gold structurally regardless of individual prints.
Why Is Gold Rising When Rate Hike Odds Are This High?
On the morning the JOLTS report arrived, job openings for April totaled 7.62 million versus an expected 6.88 million — a surprise of nearly 750,000. Combined with recent ADP private payrolls, the data reinforce that the labor market remains resilient. Under the conventional model, that should weigh on gold: a strong labor market gives the Federal Reserve room to raise rates, higher rates boost bond yields and the dollar, and a non‑yielding asset like gold becomes less attractive.
Yet gold is trading higher today, up roughly $43 to about $4,477 per ounce. At the same time, markets have lifted the probability of a December 2026 Fed hike to around 85% on the CME FedWatch tool, effectively pricing out cuts for the year and making a year‑end hike the base case. Why isn’t gold falling? The short answer: the standard textbook relationship between interest rates and gold is incomplete. The real variable that matters for gold is the real yield — nominal yield minus inflation — not the nominal fed funds rate alone.
Why Does Gold Rise When Rate Hike Odds Rise?
The textbook model is accurate in a healthy economy where inflation is under control: higher policy rates raise real yields, bond returns improve in real terms, the dollar strengthens, and gold typically underperforms. That dynamic was visible from roughly 2022 through early 2024, when a rapid succession of Fed hikes pushed real yields from deeply negative toward positive territory and pressured gold.
But when the economy faces stagflation — slow growth or stagnation alongside rising inflation — rising nominal rates do not guarantee rising real yields. If inflation accelerates alongside or faster than the policy response, nominal rate increases can leave real yields flat or still negative. For savers and bond investors, purchasing power is what matters; a 25 basis point hike when headline inflation runs near 3.8% barely changes the real‑return picture.
Gold, which does not pay a coupon, competes on the basis of real purchasing power preservation. When real yields remain low or negative, gold retains its appeal even as nominal rates climb. That is the mechanism the headlines often miss: higher nominal rates can coexist with a favorable environment for gold if real yields do not move convincingly higher.
Did Gold Actually Rise During Rate Hikes in the 1970s?
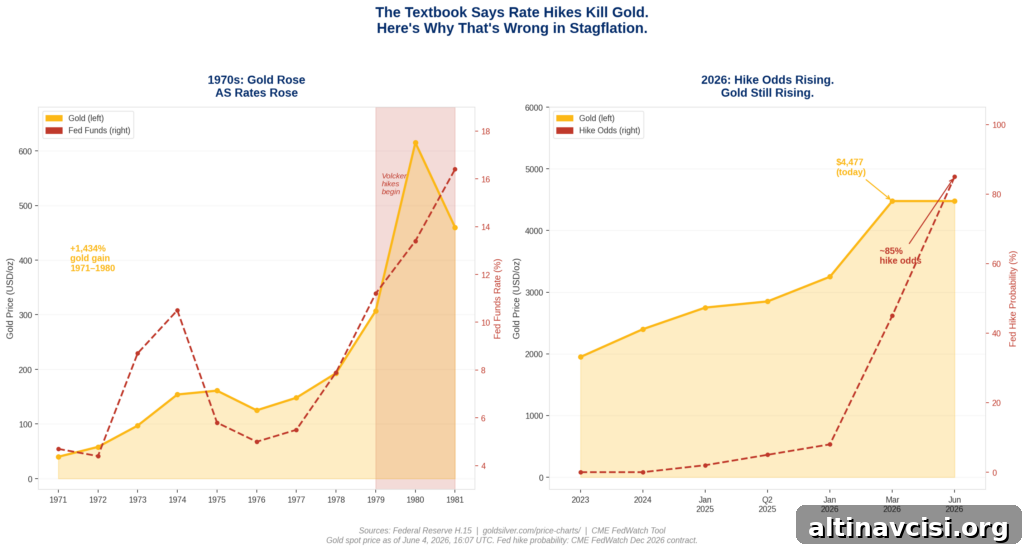
The 1970s provide a clear historical example. From 1971—when the U.S. left the gold standard—to 1980, the Fed’s policy rate rose from roughly 4.7% to nearly 20%. Conventional logic would predict a falling gold price with such aggressive rate hikes, but gold instead surged from about $40 per ounce to a peak near $850 in early 1980. Why? Because inflation was persistent and expectations became unanchored. Investors focused on real yields and whether the central bank could and would restore price stability.
Paul Volcker’s tenure is instructive because he ultimately did what was necessary to break inflation expectations: he pushed real yields sharply positive, accepting a deep recession and very high unemployment as the cost of restoring credibility. That decisive move is what ended the gold bull market in that era. Today’s policy and fiscal constraints make a repeat of that Volcker outcome far less likely.
Why Can’t the Fed Run the Volcker Playbook Today?
At present, the federal funds rate sits in the mid‑3% range and markets expect at least one more 25bp hike by year‑end. With headline PCE inflation near 3.8% and the 10‑year Treasury yielding around the mid‑4% range, real yields are only marginally positive. Achieving Volcker‑era real rates (+4% or more) today would require nominal policy rates far higher than the current economic and fiscal environment can sustain.
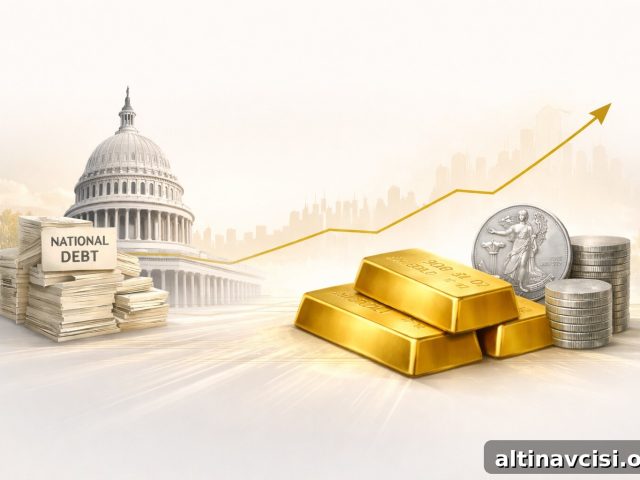
U.S. federal debt is approaching $39 trillion and annual interest costs already exceed a trillion dollars. A rate path that pushed policy and market yields toward the double digits would dramatically raise interest expenses and risk fiscal instability. The Fed faces a difficult choice: tighten enough to crush inflation at the cost of breaking fiscal math, or tolerate higher inflation and maintain lower real yields. That constraint helps explain why gold can rise even as nominal rate‑hike odds climb.
What Does “Trapped” Mean for Physical Gold Owners?
Put simply: in a normal tightening cycle, gold suffers as real yields and the dollar rise. In a stagflationary scenario, nominal hikes can signal policy desperation rather than victory. Bonds with fixed coupons lose real purchasing power if inflation outpaces yields, while gold’s value is preserved in real terms. That dynamic made gold a strong performer in past periods of rising inflation and stagnant growth.
An additional feature of the current cycle is that central banks are net buyers of gold. Continued official purchases — confirmed by industry data showing sustained central bank demand — reinforce structural support for prices. Central banks can raise rates to defend currencies and credibility while simultaneously accumulating gold as a hedge against the inflationary and fiscal risks they face.
Why Does the Monthly Jobs Report Cut Both Ways for Gold?
Monthly employment data like nonfarm payrolls often generate immediate market moves, but they are noisy. A strong jobs print raises the probability of Fed tightening, which can pressure gold in the short term. Still, a modest policy response against elevated inflation leaves real yields largely unchanged, so the structural case for gold remains. Conversely, weak jobs data sharpens the stagflation narrative — slow growth plus persistent inflation plus limited ability to hike decisively — which tends to be bullish for gold in a more sustained way.
The durable lesson: short-term volatility around data releases matters for traders, but the real‑yield dynamic drives gold’s medium‑ and long‑term trend.
What Would Actually Break the Gold Thesis?
The thesis is vulnerable to one clear outcome: a policy regime that pushes and sustains real yields well into strongly positive territory (comparable to the Volcker period). If a future Fed chair managed to lift real yields decisively above +4% for a sustained period and thereby re‑anchor inflation expectations, gold’s stagflation hedge appeal would diminish. Achieving that now, given the scale of public debt and the fiscal consequences of very high rates, appears unlikely. Until real yields rise and stay meaningfully positive, the forces supporting gold remain in place.
The Knowledge That Changes Everything
Two concise guides to help you understand why gold matters, how fiat systems depreciate, and how to think about precious metals in a stagflationary world.
Subscribe to receive the guides and occasional market insights.
Stay On Top of Gold & Silver Prices
Get important market alerts sent straight to your inbox.
Sign up for timely price alerts and analysis focused on real yields, inflation trends, and implications for gold and silver.
SOURCES
1. Gold & silver price charts (industry price sources)
2. Bureau of Economic Analysis — Personal Consumption Expenditures (April 2026)
3. Bureau of Labor Statistics — Job Openings and Labor Turnover Summary (April 2026)
4. World Gold Council — Gold Demand Trends Q1 2026
5. Fiscal data and interest‑cost projections (public fiscal trackers)
6. CME Group — FedWatch Tool data and probabilities
7. Market commentary and strategist notes (June 2026)
Disclaimer: This article is informational only and does not constitute financial or investment advice. Consult a qualified adviser before making investment decisions.
You may also like:
- Gold Confiscation: Could the Government Take Your Gold Again?
- Gold Price History: From $35 to $4,500 in 100 Years
- The Debasement Trade Explained: Mechanism, History, and What It Means for Gold
- Gold or Silver First? A First‑Time Buyer’s Framework
- Gold Reserves by Country: The 2026 Rankings
- Gold Portfolio Allocation: Why Wall Street Is Rewriting the 60/40
- What Does the SILVER Act Mean for Precious Metals Investors?
- What Backs the U.S. Dollar? Not Gold. Not Silver.
- Why Is Gold Valuable? The 5,000‑Year Answer Most Investors Get Wrong
- 72% of Family Offices Hold No Gold. What They’re Missing.
Popular Topics
Picked from the archive
-
01
 Topics
Incrementum August 2025 Gold Compass Report: 50+ Charts
-
02
Topics
Gold Slumps 14% in March as Inflation Lingers
-
03
Topics
Inflation Holds at 3.0%, Gold Funds Post Historic Rally
-
04
Topics
Banks Forecast Gold Over $5,400 After Greenland News
-
05
Topics
Gold Falls After U.S. Wholesale Prices Surge
-
06
Topics
How Government Debt Drives Gold and Silver Prices
-
07
Topics
Wall Street’s $6,000 Gold Call Relies on Hidden Data
-
08
Topics
USD Falls to Seven-Week Low as Gold Price Hits New High