Silver Price Outlook May 2026: Focus on Trends, Not Numbers
Key Takeaways
- Silver jumped 6% on May 11 after a US–China 90-day tariff truce, but pulled back after hotter-than-expected April CPI raised the odds that the Fed will delay rate cuts. The metal is balancing a reopening-driven industrial demand story against a central bank that looks unlikely to ease before autumn.
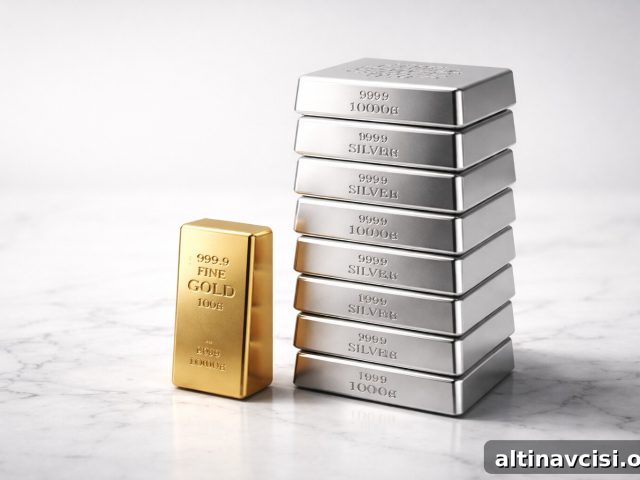
- The gold/silver ratio compressed rapidly from roughly 62:1 to about 55:1 in one week in May 2026 — one of the fastest moves in recent years — underscoring that silver’s recent strength was driven primarily by industrial-demand expectations rather than safe-haven flows.
- The structural case remains intact: six consecutive years of supply deficits, nearly 762 million ounces drawn from inventories since 2021, and a physical market that is tighter than many investors appreciate.
Last verified: June 20, 2026 — Live silver price at GoldSilver.com
Silver reached an all-time high of $121.64 on January 29, 2026. It gave back much of that gain through February and March and then traded in a $70–$80 range in April. On May 11 a US–China tariff truce sparked a one-day 6% surge, briefly pushing prices toward $87 by May 13. However, April’s CPI print came in higher than expected at 3.8%, which reduced the likelihood of an immediate Fed cut and pulled silver back toward $84. That single week encapsulates the environment investors face when considering any silver price forecast for May 2026.
Silver is a hybrid asset: part monetary metal, part industrial commodity, and part speculative vehicle. In periods of risk aversion it behaves more like gold; when manufacturing demand is strong it behaves like an industrial metal. In dovish rate cycles it often amplifies gold’s moves by two to three times. In May 2026, these influences were tugging in different directions, so relying on a single thesis for a price forecast is likely to be misleading.
What Is the Gold/Silver Ratio Telling Us Right Now?
Entering May 2026 the gold/silver ratio was near 62:1. After the tariff truce it compressed below 55 in about a week, a very rapid shift. Gold barely moved while silver did most of the work, signalling that the market was repricing industrial demand rather than moving into a safe-haven trade.
For context, the ratio fell to about 31:1 at the 2011 silver peak and spiked to roughly 125:1 during the COVID crash in 2020. Long-term averages vary by era: the twentieth century averaged around 47:1, while the post-2000 modern average sits closer to 60–65:1. At 55:1 in mid-May, silver was cheaper relative to gold than its modern average, though it had already shifted considerably from the 80:1 levels seen in late 2025.
Near-term direction for the ratio hinges on two key events: the outcome of the Trump–Xi summit and decisions from the Federal Reserve. If the tariff truce is extended credibly, the ratio could compress further; if trade talks break down, it could reverse. A sustained move below 50:1 historically signals silver leadership during bull markets, while a return above the prior levels would indicate the tariff-driven repricing is fading. By June 2026, the ratio expanded back toward the mid-60s following a hawkish Fed outlook, demonstrating how quickly sentiment can shift.

Your Gold Buying Guide Most investors overpay on purchase and again when they sell. This guide explains what to own and why.
Silver Price Forecast May 2026: What Are Analysts Actually Predicting?
Consensus among institutions shifted substantially since January. Bank of America published a wide scenario range in April ($135–$309 year-end) based on aggressive ratio-compression outcomes rather than a base case, while UBS lowered its year-end view from $85 to $80 citing demand weakness at higher prices. The gap between the lowest and highest forecasts is unusually large — itself a signal that the market lacks a clear consensus.
Individual forecasts vary: J.P. Morgan estimated a 2026 average near $81/oz, Goldman Sachs placed a 2026 average in the $85–$100 range, and Citigroup set a second-half target near $110, highlighting acute physical shortages. ING was more conservative with an average around $78, and the Reuters median of 30 analysts sat near $79.50. With silver trading in the mid-$80s in May, it already exceeded many of these full-year averages, implying either upward revisions from forecasters or a softer price path later in the year before recovery.
The important signal to watch is not any single target but the direction of analyst revisions during the year. Upgrades from major houses would be bullish; downgrades would indicate a tougher path ahead.
Why Does Silver’s Structural Supply Deficit Matter?
Beneath headline volatility, the structural supply story remains unchanged. The market was heading into a sixth consecutive annual supply deficit, with a projected shortfall near 46 million ounces for 2026. Unlike gold, a large share of silver is consumed in industrial applications — especially solar panels, electric vehicles, semiconductors and medical devices — and much of that offtake is effectively permanent.
Cumulative draws from above-ground inventories since 2021 totaled nearly 762 million ounces, close to nine months of global mine output. COMEX registered holdings fell from around 531 million ounces in October 2025 to roughly 315 million ounces by early 2026, and significant physical flows left the United States in the opening months of 2026. Annual mine production has remained near the low-800 million ounce range, and roughly 70% of silver is produced as a byproduct of other metals, limiting supply responsiveness. Lead times for new primary silver supply are long — often many years — so production does not expand quickly in response to price spikes.
There are genuine demand offsets: photovoltaic manufacturers are reducing silver per panel and PV-related consumption was expected to fall year-on-year, while jewellery and silverware demand also showed declines. Still, silver’s unmatched electrical and thermal properties make large-scale substitution difficult, and new demand from electrification, data centres and 5G infrastructure is likely to keep pressure on available physical supply through the late 2020s.
How Do Real Yields Drive the Silver Price?
Real yields are a key short- to medium-term driver for silver. Prior to May 13, CME FedWatch priced roughly a 48% chance of a June rate cut, but the hotter April CPI print pushed that probability sharply lower — under 8% within hours — moving the market’s earliest expected easing to September or later. That shift changed the immediate prospect for silver, which historically amplifies moves in gold when real yields fall.
The Fed had cut rates through 2025 to a 3.50–3.75% range and was holding in that area across several meetings. The June 16–17 FOMC meeting and its updated dot plot were the next major policy signals investors watched. A hawkish dot plot reinforcing a pause would likely extend silver’s consolidation, while any indication of easing beginning in September would give the metal fresh upside momentum. Past easing cycles show silver can amplify gold’s gains by 2–3x, but periods of Fed pause typically see consolidation rather than decisive new highs.
People Also Ask
What is the gold/silver ratio telling investors in May 2026?
The ratio’s rapid compression from ~62:1 to ~55:1 after the tariff truce was driven almost entirely by silver, confirming an industrial-demand repricing rather than safe-haven buying. At that level silver was inexpensive relative to its modern post-2000 average, but the ratio can reverse quickly depending on trade and monetary outcomes.
Why is silver so volatile in May 2026?
Volatility stemmed from competing forces: a positive industrial-demand catalyst from a US–China tariff truce, a negative monetary shock from hotter-than-expected CPI that delayed Fed easing expectations, and ongoing geopolitical risks. Those mixed signals produced sharp moves up and down in short order.
What is the silver supply deficit and why does it matter?
The market faced a multi-year structural deficit with cumulative draws of nearly 762 million ounces since 2021 and limited supply elasticity because most silver is a byproduct of other mining operations. That persistent physical tightness supports a structurally bullish long-term case even amid near-term volatility.
What are analysts forecasting for silver in 2026?
Forecasts spanned a wide range. Some houses predicted full-year averages in the high $70s to low $80s, while others projected significantly higher outcomes for the back half of 2026 under ratio-compression scenarios. With silver trading in the mid-$80s in May, many consensus averages were already exceeded, making mid-year revisions a key indicator to watch.
How does the June 2026 Fed meeting affect silver?
The June FOMC meeting and its dot plot were central to the short-term outlook. A hawkish signal would prolong consolidation; any indication of easing in the autumn would materially improve silver’s upside prospects. The Fed’s communication is effectively the roadmap for silver’s next near-term leg.
The Pause Is Not the Story
The near-term bear case is clear: a breakdown in trade talks, a dot plot signalling no cuts this year, and persistent inflation would keep prices subdued. For most investors the prudent approach is a deliberate, sized allocation rather than an all-in bet on the next move.
But the structural thesis remains: multi-year deficits, irreversible industrial consumption, and limited supply responsiveness. The tariff truce in May 2026 acted as a near-term catalyst; the deficit provides a multi-year floor. Any credible silver price forecast for May 2026 must weigh both the short-term policy and trade dynamics and the long-term physical tightness simultaneously. That dual framework — not a single number — is the most useful guide.
SOURCES
Live gold and silver spot prices, World Silver Survey 2026, industry reports and central bank publications as of mid‑2026.
Disclaimer: This article is for informational and educational purposes only and does not constitute investment advice. Consult a qualified financial adviser before making investment decisions.
You may also like:
- Dollar Dominance Is Fading. Gold and Silver Are Paying Attention.
- GoldSilver: Home Storage and Vault in One Account
- The Bond King’s Golden Signal: Jeffrey Gundlach on Gold
- Gold Price Outlook May 2026: Why Institutional Forecasters Still See $5,000
- India’s ‘Patriotic’ Gold Buying Freeze: What It Means for Prices
- How to Time Your Gold & Silver Buys Using Technical Analysis
- Silver Jewelry or Bullion? A Buyer’s Guide to the Real Difference
- Gold and Oil Move Opposite Ways. Here’s Why That Matters
Popular Topics
Picked from the archive
-
01
 Topics
Trump Imposes 25% Tariff on India’s Oil Imports From Russia
-
02
Topics
Gold Silver Ratio Forecast: Buy Gold, Add Silver or Wait?
-
03
Topics
WGC Q1 2026: Asian Insights Wall Street Overlooks
-
04
Topics
Silver Market Rally 2025: Should You Take Profits Now?
-
05
Topics
Store Gold at Home Securely: Safes, Security and Insurance
-
06
Topics
Treasury Yields Flat Amid Jobs Slump and Trump Policy Chaos
-
07
Topics
Outcrop Silver Bonanza: 1,877 g/t at Colombia’s Morena Vein
-
08
Topics
Gold Rises Ahead of Crucial US Inflation Report