Gold Price Reaction to Jobs Report – Pre-Market Guide

Gold and silver market update — May 5, 2026
Key Takeaways
- Consensus for the May 8 Nonfarm Payrolls (NFP) release is 49,000, down sharply from 178,000 the prior month. The size of that gap matters for markets.
- Weak jobs data combined with persistent inflation is the clearest near-term catalyst for gold, consistent with stagflation dynamics.
- The structural factors — roughly $1 trillion a year in US debt interest, PCE inflation around 3.5%, and a deeply divided Federal Reserve — remain in place regardless of one data release.
On Thursday at 8:30am ET, the US labor market will deliver a high-impact data point: the monthly Nonfarm Payrolls report. Economists’ consensus is roughly 49,000 new jobs, which is less than a third of March’s 178,000. That contrast is the story heading into the release. Together with manufacturing inflation readings near multi-year highs, this jobs report could reshape market expectations about the U.S. economy. For precious metals investors, Thursday is consequential not because it changes long-term fundamentals overnight, but because it shows whether the stagflation signal that appeared in manufacturing has broadened to the wider economy.
Gold is trading near $4,560 in the context of a Personal Consumption Expenditures (PCE) inflation rate around 3.5%. The Federal Open Market Committee (FOMC) recently recorded an unusually split vote, the most divided its membership has been in decades. That split highlights a Fed constrained between raising rates to combat inflation and avoiding damage to a weakening labor market. Below are the plausible scenarios and how each could influence gold and silver prices before markets absorb the data and react.
Why Does the May 8 Jobs Report Matter So Much for Gold?
In April, the Institute for Supply Management (ISM) manufacturing report showed a Prices Paid index at 84.6 — the highest since April 2022 and one of the largest short-term jumps on record. At the same time, the ISM manufacturing employment index slipped to a 2026 low. That combination — rising input costs and falling sector employment — is the textbook definition of stagflation. Gold initially fell on the release, but the market’s reaction was muted because the data so far has been concentrated in manufacturing, which accounts for roughly 11% of the U.S. economy. The jobs report will tell investors whether inflationary pressure and labor weakness have moved beyond factories into the broader economy.
The broader takeaway is simple: if the data confirm widespread stagflation, markets will reprice the odds of prolonged higher inflation with weaker growth, and gold tends to benefit in that environment because real yields would remain depressed and demand for a hedge against debasement would rise.
What Happens to Gold If Jobs Are Weak and Inflation Stays Sticky?
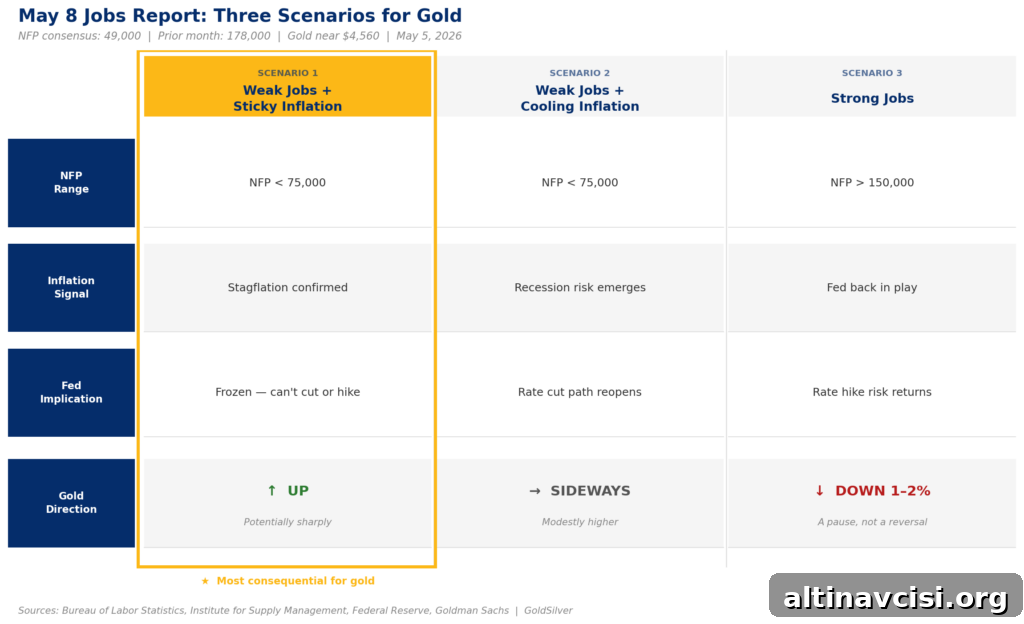
The Scenario: Nonfarm payrolls print below 75,000, the unemployment rate rises, and average hourly earnings stay elevated.
What it means for gold: In this configuration the Fed faces a policy trap. It cannot cut because inflation, as measured by PCE, remains well above target. It also cannot hike because employment is clearly contracting. That paralysis tends to keep real yields suppressed, which is constructive for gold. If the market recognizes a durable stagflation signal, investors who previously viewed the manufacturing readings as isolated may begin to reposition for a longer, higher-gold environment. Major banks and some research desks have published higher year-end targets under this exact scenario; the market’s belief that fiscal constraints reduce Fed flexibility would strengthen those forecasts.
Historically, when input-cost measures spike while employment weakens, gold has often moved higher over the following months as real yields roll over. Today’s fiscal and monetary context — elevated government borrowing costs and a divided Fed — means gold could react more sharply than in past cycles if broad-based stagflation is confirmed.
Gold’s direction: Up, potentially sharply if the print is substantially below expectations and wages remain high.
What Happens to Gold If Jobs Are Weak but Inflation Starts Cooling?
The Scenario: Payrolls are weak but wage growth slows and inflation expectations show signs of easing.
What it means for gold: These are offsetting forces. A weakening economy increases safe-haven demand for gold, while falling inflation pressures reduce the argument for long-term monetary debasement and therefore remove one driver of gold demand. In that tug-of-war, prices may drift sideways or move modestly higher as safe-haven flows offset diminished inflation hedging. Silver, which carries larger industrial exposure, would likely face more pressure if economic activity softens.
Gold’s direction: Sideways to modestly higher, with additional upside if the U.S. Dollar Index (DXY) weakens on recession fears.
What Happens to Gold If the Jobs Report Comes In Strong?
The Scenario: NFP prints above 150,000 and unemployment holds steady or falls.
What it means for gold: A strong payrolls number would strengthen the case for Fed tightening or at least keep markets expecting higher-for-longer rates. Real yields would likely rise, and gold would face headwinds as opportunity cost for holding non-yielding assets increases. That is the most straightforward bearish scenario in the short term; a strong print would probably push gold down in the low-single-digit percent range on the immediate reaction.
That said, a single strong jobs report does not erase structural constraints such as rising debt-service costs or the persistence of above-target inflation. A positive payrolls print can pause a bullish narrative, but it does not necessarily reverse multi-year trends driven by fiscal and monetary dynamics.
Gold’s direction: Down modestly near term (roughly 1–2% on the immediate reaction), acting as a pause rather than a complete reversal of the longer-term thesis.
What Else Should You Watch on Thursday Morning?
The headline NFP number often moves markets first, but the report’s internal details frequently matter more for how traders and policymakers interpret the data. Pay attention to these three items:
Average hourly earnings. If wage growth remains elevated even as hiring slows, that combination is the clearest signal of stagflation and would make the Fed’s trade-offs more difficult.
The unemployment rate. A higher unemployment rate than in the previous month suggests labor-market weakness is growing and may change how quickly policymakers react.
Prior-month revisions. Revisions to March’s payrolls figure can alter the narrative: downward revisions mean deterioration began earlier and that the Fed may already be behind the curve.
Also note the ISM Services PMI release on May 5. If services-sector Prices Paid show a similar jump to manufacturing’s, it would indicate inflationary pressure is broadening beyond goods and into services, raising the economic stakes and strengthening precious metals’ inflation-hedge appeal.
Does Any of This Change the Long-Term Case for Gold?
No. Short-term data releases will move prices, but they do not reset the structural case for gold. The multi-year forces that have supported a roughly 34% year-over-year gain in gold — including rising government debt-service costs, persistent inflation above target measures, and a Federal Reserve showing internal division on policy — remain in place. One jobs report can affect positioning and near-term price action, but the underlying fiscal and monetary pressures that favor precious metals as a portfolio hedge are longer-lived.
Stay On Top of Gold & Silver Prices
Get important market alerts and timely analysis delivered to your inbox.
SOURCES
1. Bureau of Labor Statistics — The Employment Situation, March 2026
2. TradingEconomics — Gold Spot Price, May 5, 2026
3. CNBC coverage of PCE inflation, March 2026 data
4. Federal Reserve — FOMC press conference and meeting statement, April 29, 2026
5. Institute for Supply Management — Manufacturing PMI, April 2026 report
6. Reporting on bank research and market forecasts for gold, including year‑end targets
7. Federal Reserve Bank of St. Louis (FRED) — historical gold price data
8. Congressional Budget Office — Budget and Economic Outlook, FY2026
Disclaimer: This article is for informational purposes only and does not constitute financial or investment advice. Always consult a qualified financial adviser before making investment decisions.
You May Also Like:
- The Gold-Silver Ratio Is Expanding — and Being Misread
- Gold, Silver, and Stagflation: 5 Signals That Matter Now
- Why Gold Fell on the Hormuz Tanker Strike
- WGC Q1 2026: What Asia Knows That Wall Street Doesn’t
- BEA Stripped Silver From GDP. Here’s What It Means
- PCE at 3.5%, GDP Miss: Why This Is Bullish for Gold
- How Warsh’s Inflation Measure Could Move the Gold Price
- Gold Is Down 19%. This $3.8B Bet Says It Doesn’t Matter
Popular Topics
Picked from the archive
-
01
 Topics
5 Economic Red Flags Gold Investors Need to Watch Now
-
02
Topics
Why Gold Drops During an Oil Price War
-
03
Topics
Is the Gold Price Correction Over? Rebound Signals for Investors
-
04
Topics
Why CME Margin Hikes Sparked the Silver Crash
-
05
Topics
Stagflation 2026: Hidden Signs in Today’s Data
-
06
Topics
U.S. Jobs and GDP Strengthen Ahead of Fed Decision
-
07
Topics
Bessent Urges Next Fed Chair to Do More Than Monetary Policy
-
08
Topics
Wholesale Prices Jump Most in 3 Years as Tariffs Hurt US Economy