Gold Price Per Ounce: What It Reveals About the Market
The price of gold per ounce is one figure many investors watch but few fully understand. It’s not simply a commodity quote — it is a real-time gauge of confidence in currencies, central bank credibility, and the health of the monetary system. When gold moves higher over a sustained period, it signals erosion of purchasing power somewhere in the system. Learning to interpret this number is one of the most valuable skills for a long-term investor.
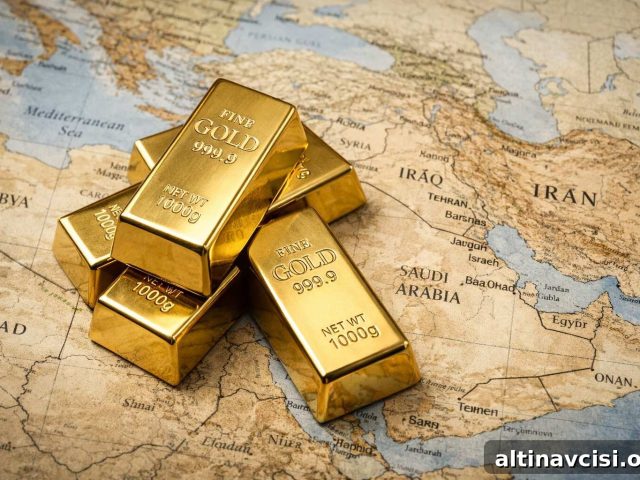
As of early May 2026, gold trades near $4,600 per ounce — about 17–18% below its January 28–29, 2026 peak of roughly $5,589–$5,595. Even after that pullback, the metal is still up roughly 75% from the start of 2025, when the spot price was about $2,624 per ounce. That rise is not merely a price move; it is a judgment on the monetary system — and the message is clear.
What Is the Gold Price Per Ounce — and How Is It Set?
The gold price per ounce refers to the spot price for one troy ounce of pure gold. This troy ounce — the standard for precious metals markets — equals 31.103 grams, unlike the common avoirdupois ounce of about 28.35 grams. The spot price is the market’s baseline and underpins the pricing of bars, coins, ETFs, and futures.
Major exchanges and markets — including London, New York, and Shanghai — set the spot price continuously, and the LBMA publishes official benchmarks during the day that institutions use to settle large transactions. When buying physical gold from a dealer, you typically pay the spot price plus a premium that covers minting, distribution, insurance, and dealer margin. In short, spot is the raw metal price; the premium is the cost of ownership and delivery.
Your Gold Buying Guide Most investors overpay when they buy gold and again when they sell. This guide explains what to own and why.
What Does the Gold Price Per Ounce Actually Tell You?
Many investors treat the gold price as a simple supply-and-demand reading for a metal. That is partly true, but incomplete. Because gold is quoted in U.S. dollars, its price always reflects both metal demand and the dollar’s buying power. When the dollar weakens, the dollar price of gold rises even if the metal’s intrinsic value is unchanged. This inverse relationship between the dollar and gold is one of the most consistent patterns in markets.
Viewed over decades, the explanation becomes clearer. Gold pays no interest, dividends, or earnings; its long-term price appreciation reflects loss of purchasing power in the currencies that measure it. For example, the U.S. left the gold standard in 1971 at $35 per ounce. Today a dollar buys only a tiny fraction of an ounce. The increase in gold’s dollar price is therefore a reflection of currency depreciation over time.
What’s Behind the 2025–2026 Price Surge?
Gold didn’t simply drift higher recently — it broke out. In 2025 the metal set dozens of record highs, climbing from about $2,624 to over $4,300 by year-end, then surging further to its January 2026 peak. Several structural factors combined to drive that advance.
Central banks dramatically increased purchases in 2025, adding hundreds of tonnes of gold to official reserves and signaling a shift toward assets with no counterparty risk. Global demand for gold exceeded 5,000 tonnes for the first time on record, and assets in gold ETFs roughly doubled, with physical holdings reaching record levels. Those are not short-term flows; they represent a structural shift in how the world allocates capital.
What Actually Moves the Gold Price?
Four primary drivers determine gold’s price and trend:
Real interest rates. When inflation-adjusted yields are low or negative, holding gold has a lower opportunity cost versus interest-bearing assets, making gold more attractive. Rising real rates create headwinds for gold, while falling real rates support it.
Dollar strength. A weaker dollar mechanically raises gold’s USD price; this is arithmetic, not sentiment. Dollar weakness has been a consistent tailwind for gold through 2025 and into 2026.
Geopolitical stress. Heightened geopolitical risk encourages investors to move capital into assets outside the financial system. Geopolitical shocks in late 2025 helped push gold above historic levels as investors sought stores of value with no counterparty exposure.
Monetary debasement. Large deficits and expanding central bank balance sheets erode fiat purchasing power over time. Gold doesn’t remove that risk; it provides a way to relocate exposure from paper to metal.
All four drivers were active during the 2025–2026 surge, prompting several major banks to raise long-term gold price targets amid the structural trend.
So What Should You Actually Do With This Information?
Daily fluctuations tell you little compared with the multi-year trend and its underlying causes. Focus on the drivers, not the day-to-day noise.
Don’t anchor to yesterday’s price. The relevant question is whether the structural forces — currency debasement, geopolitical tensions, and sovereign debt concerns — are strengthening or weakening. At present, they appear to be strengthening.
View gold across currencies. Gold reached record prices not only in U.S. dollars but also in euros, yen, sterling, and Canadian dollars. When an asset posts global records, it is often the currencies that are moving, not the metal itself.
Treat pullbacks as information, not alarm. A 17–18% decline from a peak is within historical norms for gold. Past bull markets featured similar corrections before resuming higher; such pullbacks can clear weak hands and strengthen the market.
Use the price as a signal, not a scoreboard. A multi-year rising trend in gold is one of the clearest indicators that purchasing-power protection may belong in an allocation. Physical gold — coins or bars held directly or in allocated storage — provides exposure with no counterparty risk. ETFs replicate price exposure but remain inside the financial system; in extreme stress, that distinction can matter.
Stay On Top of Gold & Silver Prices
Get important market alerts sent straight to your inbox.
People Also Ask
What is the gold price per ounce today?
As noted above, in early May 2026 the spot price is around $4,600 per troy ounce. Spot prices update continuously on major markets; live trackers provide real-time readings during market hours.
Why did the gold price per ounce hit an all-time high in January 2026?
Gold reached approximately $5,589–$5,595 per ounce on January 28–29, 2026. That peak reflected a combination of rising geopolitical tensions, a weakening dollar, record central bank buying, and persistent inflation concerns — the culmination of several structural factors rather than a single short-term catalyst.
What does a rising gold price per ounce mean for the economy?
A sustained increase in gold usually signals weakening confidence in fiat currencies, rising inflation expectations, or heightened geopolitical risk. In practice, a rising gold price often reflects issues with the paper currencies used to quote it.
What is a troy ounce and why is gold priced in it?
A troy ounce equals 31.103 grams. The troy weight system has long been the standard for precious metals, so spot prices, futures, and bar weights use it rather than the common avoirdupois ounce.
What is the difference between spot price and the price I pay at a dealer?
The spot price is the market price for immediate delivery of one troy ounce of pure gold. Dealers charge a premium above spot to cover minting, distribution, insurance, and margin. Coins usually carry higher premiums than bars due to minting costs and collector demand.
The Number Is Telling You Something — Are You Listening?
Many investors focus on gold’s price without considering what the number communicates. At approximately $4,600 per ounce — roughly 75% above its level at the start of 2025 — the signal is structural: a gradual, persistent reduction in confidence in paper money, sovereign debt, and related institutions.
That broader narrative does not change because of a single Fed statement. It changes when the underlying dynamics — growing debt burdens, currency debasement, and geopolitical fragmentation — reverse. As of early 2026, those dynamics show no sign of reversing.
Successful investors with gold typically understand what they own and why they own it, rather than attempting to time exact entry points. For continued research, resources that track historical prices, demand trends, and central bank activity can help deepen that understanding.
SOURCES
1. Trading Economics — Gold Price Chart & Historical Data
2. World Gold Council — Gold Spot Prices & Market History
3. Federal Reserve Bank of St. Louis (FRED) — Consumer Price Index, All Urban Consumers
4. World Gold Council — Gold Demand Trends: Full Year 2025
5. World Gold Council — Central Banks: Gold Demand Trends Full Year 2025
6. Reuters — J.P. Morgan commentary on gold price expectations
7. TheStreet — Goldman Sachs commentary on gold price outlook
8. CNBC — Analysis of gold’s past bull runs and corrections
Disclaimer: This article is for informational and educational purposes only and does not constitute investment advice. Consult a qualified financial adviser before making any investment decisions.
You may also like:
- The Gold Inflation Paradox Most Investors Miss
- Insurance vs. Upside: Balancing Your Portfolio with Gold and Silver
- Gold Bullion vs. Jewelry: Why Serious Investors Choose the Bar
- Gold & Silver IRA: Why Starting Early Costs You Less
- Silver Fair Value: What the Data and History Show
- Gold or Silver Price Dip: Temporary Correction or Trend Reversal?
- What Switzerland’s Gold Freeze Means for Investors
- What History Shows About Buying Gold After a Pullback
Popular Topics
Picked from the archive
-
01
 Topics
Money Manager Sues Fed Chair Powell to Force Public Rate Talks
-
02
Topics
Gold Safe-Haven Demand Returns After 9-Day Selloff
-
03
Topics
ETF Inflows Propel Gold Demand to Highest H1 Levels Since 2020
-
04
Topics
Top Economist Warns of U.S. Recession as Fed Options Shrink
-
05
Topics
10-Year Treasury Yield Rises After Tariff News, Services Data
-
06
Topics
Gold Demand in China Drops 3.5% in H1 2025
-
07
Topics
Should You Buy Gold Now During a Dip? Timing and Risks
-
08
Topics
Gold Tops $5,300 as Fed Meeting Sends Dollar Tumbling