Why Gold Surges When the Strait of Hormuz Opens and Then Falls
Gold and silver market update — April 28, 2026
Key Takeaways
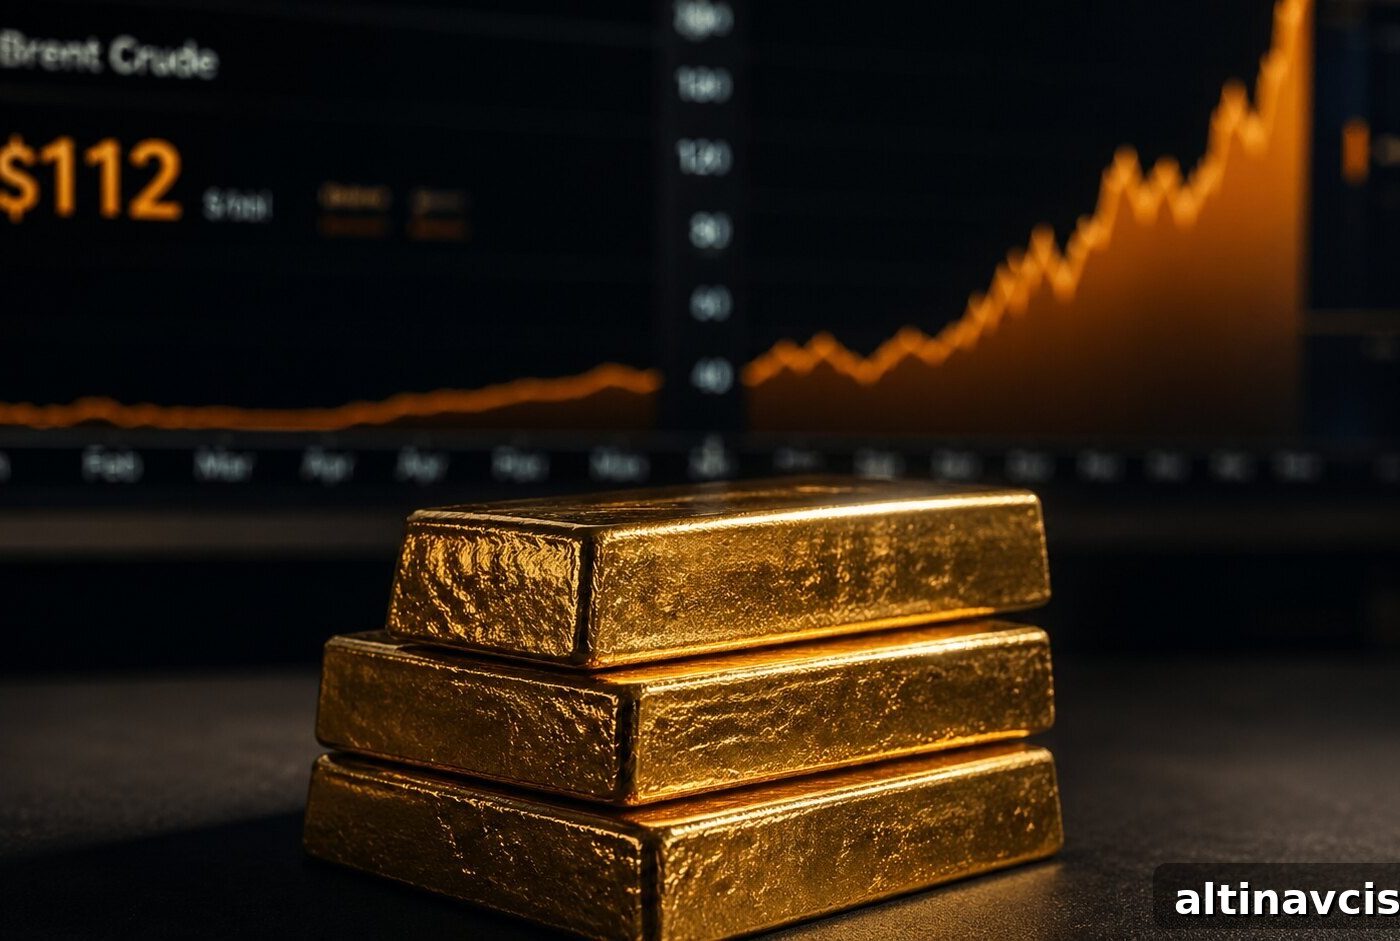
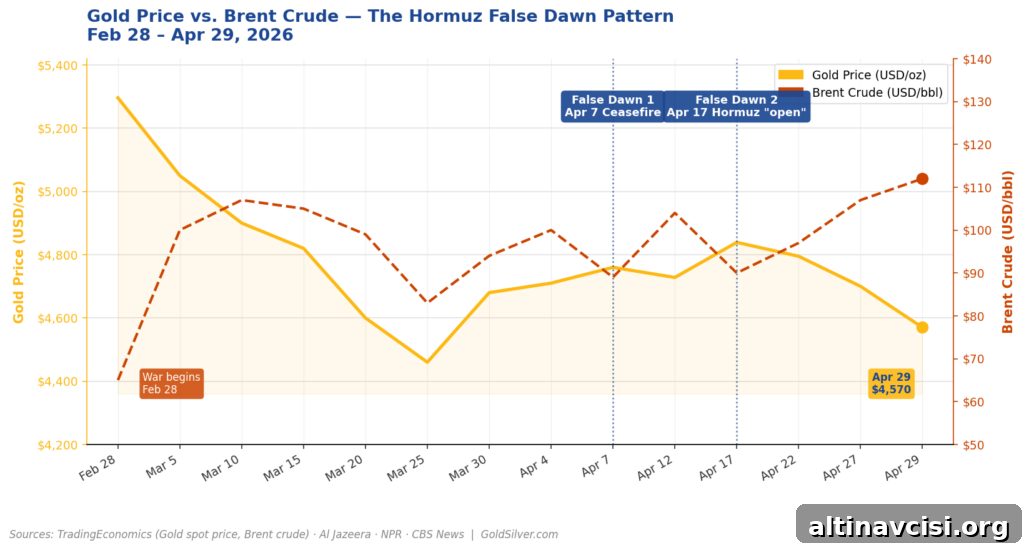
- Iran’s army confirmed it is “still in a war situation.” The latest Hormuz proposal collapsed. Brent topped $112. Gold fell about 2% to $4,570 — its lowest since late March.
- Gold is weakening because oil-driven inflation is keeping the Fed on hold, which keeps real yields elevated and reduces the immediate appeal of gold. This is a rates-and-inflation mechanism, not a collapse in confidence in the metal.
- The Strait of Hormuz has opened briefly twice since February 28 and closed again both times. These are false dawns rather than a single resolution. The structural support for gold — central bank buying and large US fiscal deficits — remains intact.
Sixty days into the Iran war, gold is doing something many investors find counterintuitive: it is falling. Oil is above $100, a regional war is active, and inflation is running at 3.3% — by conventional logic, those conditions should push gold higher. They have not. Understanding why matters more than the daily price move.
As of April 29, 2026, gold traded near $4,570 per ounce, down roughly 2% from the start of the week and nearly 19% below its all-time high of $5,589 set on January 28, 2026. Brent crude rose above $112 on April 28 — up roughly 10% on the week — after Iran’s latest Hormuz proposal collapsed. An Iranian army spokesperson today reiterated the country remains “still in a war situation.”
Price down, oil up, war ongoing. This is not a contradiction but the same mechanism playing out for a second month: oil-driven inflation keeps the Fed from easing, which keeps real yields high and constrains gold demand.
What Happened This Week With Hormuz Negotiations
On April 27, Iran submitted a fresh proposal: reopen the Strait of Hormuz in exchange for the United States lifting its naval blockade, while deferring nuclear negotiations. The White House confirmed the proposal was reviewed by the national security team.
U.S. officials described the submission as an improvement over expectations but stressed the core issue remained unresolved. Publicly optimistic rhetoric followed, but no agreement emerged and no follow-up round of talks is scheduled.
This pattern has repeated already: a ceasefire or diplomatic statement briefly opens the Strait, oil falls and gold spikes, then the blockade or restrictions resume and both markets reverse. The April 7 and April 17 openings are recent examples of these short-lived reversals.
The Edge Every Investor Needs
Smarter precious metals investing starts here. The Nuggets newsletter delivers market insights, Fed updates, global trends and educational analysis.
Subscribe for concise, timely analysis on gold, silver, and macro events that move markets.
Why Does High Oil Push the Gold Price Down, Not Up?
The relationship operates as a four-step chain. Understanding these links explains why rising oil and active conflict can coincide with falling gold.
Step 1: Oil keeps CPI elevated. March 2026 consumer prices came in at 3.3% year-over-year, the highest since May 2024. Gasoline surged sharply in the month, contributing disproportionately to headline inflation.
Step 2: High CPI keeps the Fed frozen. With inflation elevated and oil above $110, the Federal Reserve is pressured to hold policy rates. The market expects limited cuts this year unless inflation moderates.
Step 3: Rates on hold keep real yields elevated. Real yields — inflation-adjusted returns on government bonds — are the most reliable short-term driver of gold. When real yields rise, fixed income yields an attractive return and the opportunity cost of holding gold increases.
Step 4: Institutional money stays in bonds. Higher real yields draw institutional allocations toward bonds and away from non-yielding assets like gold. The result is a temporary ceiling on the gold price until the Fed can cut or inflation falls.
Banks and analysts quantify this effect: historical ETF flows show meaningful increases in gold demand after rate cuts. For example, a series of cuts would likely draw hundreds of tonnes of ETF demand over months. That sequence requires lower oil and easing inflation — conditions that have not yet materialized.
In upside scenarios where the Strait remains restricted and oil averages much higher for an extended period, inflation would eventually overwhelm the real-yield headwind and the ceiling on gold would flip into a strong support level.
Is the Strait of Hormuz Reopening a Single Event or a Long Process?
The last 60 days suggest a drawn-out process with recurring false dawns, not a one-off event.
The Strait has been effectively interrupted since February 28, 2026. It opened briefly on April 7 and April 17 under temporary ceasefire conditions, only to close again within days. Supply disruptions of this magnitude typically take weeks or months to resolve, and headlines that promise a sudden fix have repeatedly proved premature.
Each false dawn follows a predictable market rhythm: oil falls, inflation expectations ease, odds of Fed cuts rise, real yields compress, and gold rallies — then oil rebounds and gold gives back gains. Recognizing that pattern is more useful than reacting to each diplomatic headline.
What has not changed is the structural case for gold. Central bank purchases in 2025 remained high, and large fiscal deficits and rising debt-service costs continue to support long-term demand for the metal. These dynamics form a durable floor under the market.
When the Hormuz situation eventually resolves — oil falls, CPI cools, and the Fed can cut — the ceiling will lift and gold could resume an upward trend toward prior highs. The required macro sequence simply has not begun in earnest.
What Should Gold Investors Watch This Week?
Thursday, April 30 — Q1 GDP, Core PCE, Employment Cost Index
Expect closely watched U.S. data that will clarify the stagflation outlook. Atlanta Fed GDPNow estimates tracked Q1 growth down from earlier expectations. If the print shows slow growth alongside inflation above 3%, the Fed’s rate-hold stance becomes more entrenched and the ceiling on gold will remain.
Brent above or below $110
Sustained Brent prices above $110 keep the inflation-driven ceiling fully engaged. A durable move below that level would allow the rate-cut calculus to shift, potentially easing the headwind on gold.
Iran’s language, not just proposals
Official tone matters. Phrases like “still in a war situation” signal that a lasting settlement is distant. Watch for language that describes a “permanent reopening framework” rather than temporary or conditional openings; that would be a more convincing signal of durable supply normalization.
The macro forces behind gold’s strong year-over-year gains remain in place. Right now, the ceiling is the dominant force. Upcoming data and sustained moves in oil and diplomatic language will determine which side — ceiling or floor — drives prices next.
SOURCES
1. Al Jazeera — Iran War Live: Iranian Army ‘Still in War Situation’; Gulf Leaders Meet
2. NPR — Coverage of diplomatic deadlock over Iran’s nuclear program and the Strait of Hormuz
3. NBC News — Reporting on U.S. response to Iran’s Hormuz proposal
4. Bureau of Labor Statistics — Consumer Price Index, March 2026
5. Trading Economics — Brent crude price data, April 28, 2026
6. Trading Economics — Gold spot price data, April 28–29, 2026
7. CBS News — Historical perspective on gold’s record prices
8. Market commentary — Major bank oil forecasts and scenarios discussed April 2026
9. Major investment banks — Notes on gold, ETF demand and rate-cut frameworks (April 2026)
10. World Gold Council — Gold demand trends, full year 2025
11. Congressional Budget Office — Budget and Economic Outlook: 2026–2036
12. International Energy Agency — Global oil supply disruption assessments, 2026
13. Federal Reserve Bank of Atlanta — GDPNow Q1 2026 estimate (April 21, 2026)
By the GoldSilver Editorial Team — helping investors understand sound money since 2005. This article is for informational purposes only and does not constitute financial, investment, or tax advice. Always consult a qualified financial advisor before making investment decisions.
You May Also Like:
- Oil Hits $100 and OPEC Is Fracturing. Gold Knows Why
- How China Restricts Silver Supply Without Touching Silver
- Powell Press Conference: What It Means for Gold
- Iran Blinked — One Word From Powell Decides What Happens Next
- COMEX Silver First Notice Day April 30: What to Watch
- What Warsh as Fed Chair Means for the Gold Price
- 5 Signals the Mainstream Gold & Silver Narrative Missed
- Before the Fed Speaks, Watch This Number for Gold
Popular Topics
Picked from the archive
-
01
 Topics
Federal Reserve Pauses While Debt Soars: Gold Outlook
-
02
Topics
Treasury Secretary Urges Fed Rate Cut After Revised Jobs Report
-
03
Topics
Why Metals Led Markets in 2025 and What It Means for 2026
-
04
Topics
Numismatic vs Bullion Coins: Which Should You Buy?
-
05
Topics
How the Current Gold Rally Compares to Past Bull Markets
-
06
Topics
World Gold Council: Gold Nears Technical Break as Markets Stall
-
07
Topics
Central Bank Gold Sales and Their Impact on Prices
-
08
Topics
Gold at $3,400 as Markets Await Aug 28, 2025 PCE Data