Key Indicator to Watch for Gold Ahead of Fed Decision

Gold and silver market update — April 24, 2026
Key Takeaways:
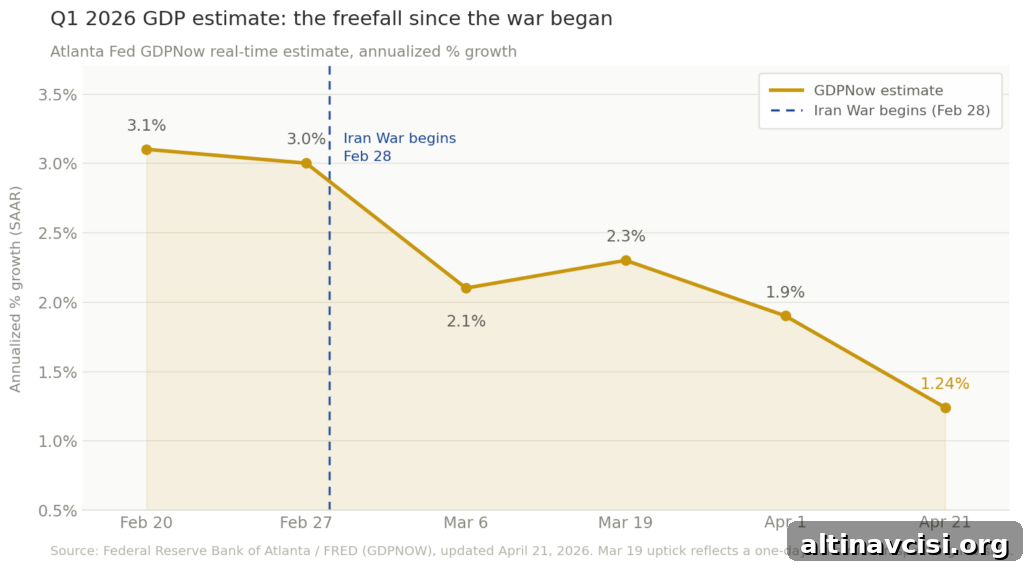
- GDPNow (April 21): The Atlanta Fed’s GDPNow model estimates Q1 2026 GDP at an annualized 1.24%, down sharply from 3.1% in late February.
- GDP release date: The Bureau of Economic Analysis will publish its advance estimate for Q1 GDP on April 30 at 8:30am EDT — one day after the Federal Reserve’s April 29 meeting and Powell’s final press conference as Fed chair.
- Stagflation setup: A combination of weak GDP (~1.24%), CPI at 3.3% (BLS, April 10), and Brent crude around $106 (April 24) creates the conditions where the Fed has limited policy options and the opportunity cost of holding gold falls.
- Gold benefits either way: If GDP is weak, stagflation and financial repression are confirmed; if GDP is stronger, structural drivers — large deficits, central bank buying, and geopolitical risk around Hormuz — remain in place.
- Watch the PCE deflator: If weak growth and a hot PCE deflator appear in the same BEA release, stagflation shifts from analysis to confirmed official data.
Market attention is on the Federal Reserve’s April 29 meeting and Powell’s press conference, where a hold is already widely expected. But the more consequential economic read for precious metals follows the Fed meeting: the BEA’s advance estimate of Q1 GDP on April 30.
The Atlanta Fed’s GDPNow tracker fell from 3.1% in late February to 1.24% by April 21. That downward revision largely reflects the economic shock tied to the conflict that began around February 28 and the sharp rise in oil prices. The April 30 official GDP release will be the first hard data that quantifies how much that geopolitical shock affected US growth.
What does weak Q1 GDP mean for the gold price in April 2026?
Q4 2025 GDP was reported at just 0.5% annualized, and many expected a rebound in Q1. Instead, estimates collapsed as the geopolitical situation pushed oil prices higher and growth prospects dimmed. The official BEA print on April 30 will settle a debate that has so far relied on models and partial indicators.
There are two clear scenarios for gold:
Scenario A — Weak GDP (near 1.24% or lower): That outcome would confirm a stagflationary environment: weak growth alongside persistent inflation. In that case the Fed faces a dilemma — cutting risks fueling inflation while raising risks choking off already-slow growth. With real yields negative or barely positive, financial repression becomes the working condition: savers receive a poor real return on cash and seek alternatives. Historically, similar stagflationary episodes saw strong relative performance from gold. The metal benefits because cash and Treasury yields offer unattractive real returns, not merely from fear-driven demand.
Scenario B — GDP surprises higher (around 2% or more): A stronger print would support a soft-landing narrative and allow the Fed to remain patient. Even then, the structural case for gold would remain intact: large budget deficits, ongoing central-bank purchases of physical gold, and geopolitical risks continue to erode confidence in holding only fiat assets.
The Edge Every Investor Needs
Smarter precious metals investing starts here. The Nuggets Newsletter delivers market insights, Fed updates, global trends, and educational material to help you navigate gold and silver markets.
Why the Fed is constrained — and what that means for savers
The key question for gold right now is: what happens when the central bank cannot move decisively in either direction? That stalemate — when policy rates remain below inflation — is the textbook definition of financial repression. In that regime, savers face negative or very low real returns, while governments and borrowers benefit.
If GDP remains weak at the next print but inflation remains elevated, the Fed cannot easily cut rates without risking a renewed inflation surge. It also cannot raise rates without further slowing an economy that is already fragile. That combination suppresses the real yield on cash and government debt, making non-yielding assets that preserve purchasing power — like physical gold — comparatively attractive.
Central-bank gold purchases underline this trend. The World Gold Council’s forecasts and recent official-sector buying show sustained interest from several countries seeking to diversify reserves away from major fiat currencies. Combined with a large deficit outlook and ongoing geopolitical risk around oil transport routes, these forces point to persistent pressure on fiat purchasing power over the medium term.
What gold holders should watch in the April 30 BEA release
Until now, much of the stagflation discussion has relied on models, nowcasts, and partial indicators. The BEA’s advance GDP release will provide the first official comprehensive snapshot for Q1. Three items in that report deserve close attention:
- Headline GDP: A print below 1.5% would align with the GDPNow trajectory; a reading above 2.0% would challenge it.
- PCE price deflator: This broader inflation gauge is the Fed’s preferred metric. Any acceleration versus Q4 2025 strengthens the stagflation case.
- Real final sales to private domestic purchasers: This measure removes volatile inventory shifts and offers a clearer view of underlying demand.
Markets have overwhelmingly priced in a Fed hold on April 29. The asymmetry to monitor is that the April 30 BEA report is far less priced in. A combination of weak growth and hotter-than-expected PCE would be a clear, market-moving confirmation of stagflation — a development with important implications for precious metals.
Stay On Top of Gold & Silver Prices
Receive timely market alerts and analysis straight to your inbox.
SOURCES
1. Federal Reserve Bank of Atlanta — GDPNow Q1 2026 Real-Time Tracking
2. U.S. Bureau of Economic Analysis — GDP estimates and releases
3. U.S. Bureau of Labor Statistics — Consumer Price Index, March 2026
4. Congressional Budget Office — Budget and Economic Outlook: 2026 to 2036
5. World Gold Council — Central Bank Gold Statistics
6. Major business press reporting on oil price moves and Strait of Hormuz developments
7. CME Group — FedWatch Tool and rate expectations
By the GoldSilver Editorial Team — helping investors understand sound money since 2005. This article is for informational purposes only and does not constitute financial, investment, or tax advice. Consult a qualified financial advisor before making investment decisions.
You May Also Like:
- Gold Price Today: What to Watch Before the April 29 FOMC
- What’s Driving Gold Prices? Oil, PMI, and Newmont
- Dollar Weakens, Gold Falls — and That’s Actually Bullish
- Why Chinese Silver Imports Hit a Record in 2026
- What Drives Gold Prices? Five Forces Investors Are Watching
- The Gold-Silver Ratio Signal: What Silver’s Lead Means
- Gold Drops to $4,681 — Iran Ceasefire Expires Today
- The Real Reason Gold Is Down During an Oil War
Popular Topics
Picked from the archive
-
01
 Topics
Gold, Silver Prices Hold Steady Ahead of Jackson Hole Summit
-
02
Topics
Gold Price to Hit $5,500 by Q1 2027? Central Bank Risk
-
03
Topics
Gold and Silver Rally After Venezuelan Shock Roils Markets
-
04
Topics
Inflation Under Trump: Fact Check on Price Changes
-
05
Topics
Trump Tours $2.5B Fed Renovation, Presses Powell on Rates
-
06
Topics
How the London Gold Fixing Shapes Global Gold Prices
-
07
Topics
Is Gold Overpriced or Undervalued? What 3 Models Reveal
-
08
Topics
USD Falls to Seven-Week Low as Gold Price Hits New High