Why Gold Prices Are Falling Amid the Oil War
Gold and Silver market update – April 21, 2026
Key Takeaways
- Gold is down ~10% since February 28. This decline reflects macro repricing caused by the Iran War’s oil shock, which raised inflation and removed near-term rate-cut expectations — a dynamic that temporarily depressed paper gold through higher real yields.
- Paper and physical gold diverged. Futures and ETF flows fell as institutions rebalanced, while physical premiums widened and retail demand remained firm, indicating the spot dip shows ownership structure rather than a wholesale loss of gold’s long-term case.
- Fiscal fundamentals remain intact. Annual U.S. deficits near $1.9 trillion and roughly $1 trillion in annual debt service (CBO estimates) continue to exert upward pressure on long-run inflation expectations and cap real yields — the primary multi-year bullish driver for gold.
- Suppression should reverse when oil falls. Lower oil would ease CPI, restore rate-cut expectations, compress real yields and allow paper gold to recover. Analysts estimate the war’s price drag on gold could be as much as several hundred dollars per ounce.
- Silver is leading the rebound. Silver recovered faster from the war-induced low, compressing the gold-silver ratio toward its long-run mean and signaling stronger industrial and precious metals demand dynamics.
Since the Iran War began on February 28, 2026, the gold price has declined roughly 10% while oil has surged nearly 60%. At first glance this seems counterintuitive: energy-driven inflation should boost gold as an inflation hedge. The explanation lies in how that inflation interacts with monetary policy expectations and real yields — not in a breakdown of gold’s role as sound money.
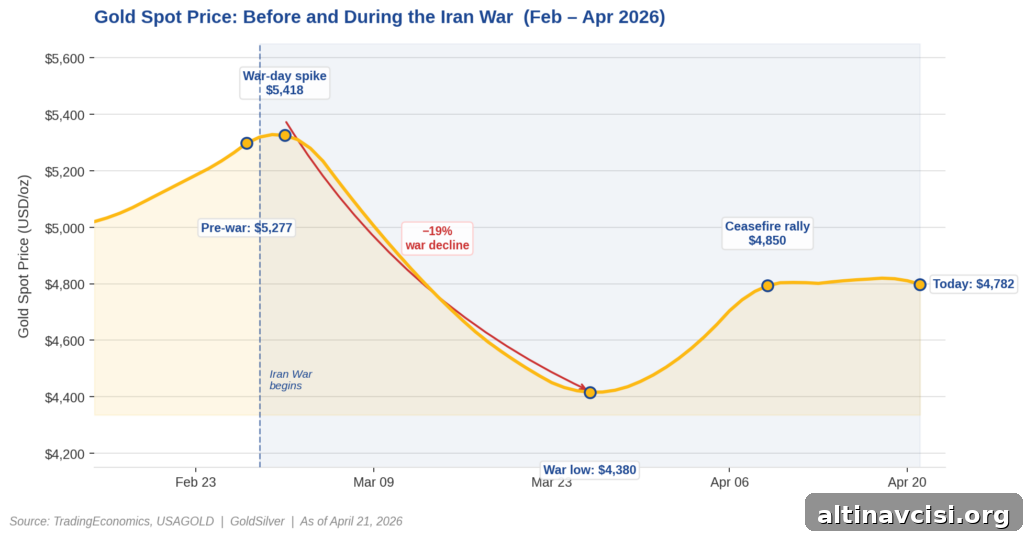
Why Is Gold Falling During an Inflation Shock?
The core mechanism is real yields: nominal bond rates minus inflation expectations. The Iran War drove oil prices sharply higher, which raised headline inflation expectations. But because the shock is energy-driven and risky for growth, the Federal Reserve has remained restrictive longer than markets expected. That combination keeps real yields higher than they would be in a cyclical demand-driven inflation scenario. Gold does not pay interest, so when real yields rise or stay elevated, holding paper gold (futures, ETFs) carries a higher opportunity cost. Institutional investors adjusted portfolios accordingly, trimming exposure to paper bullion even as physical demand persisted.
Put simply: the metal tracks real yields more closely than headline inflation. Energy-led inflation that forces the Fed to remain tight can create a period where gold underperforms, even though the longer-term macro drivers supporting gold — large deficits and rising debt service — remain in place.
What Is the Difference Between Paper Gold and Physical Gold?
“Paper” gold — COMEX futures, large ETFs like GLD and IAU — behaves like a financial asset. It responds rapidly to interest-rate expectations, margin requirements and institutional risk models. When rate-cut odds decline and real yields rise, paper positions are vulnerable to liquidation and price moves driven by macro positioning.
Physical gold — coins, bars and allocated holdings at dealers and vaults — reacts differently. Dealers report wider premiums above spot when paper prices fall, reflecting tighter physical availability and sustained retail demand. People who purchased physical coins for savings or insurance don’t typically sell in response to short-term futures repricing. That divergence explains why spot price movements can misrepresent true physical demand.
Owning physical metal versus paper exposure matters in this environment because each responds to macro shocks in distinct ways.
Does the Iran War Change the Long-Term Case for Gold?
No. The primary multi-year drivers for gold are fiscal and structural, not short-term geopolitics. The U.S. is running an annual deficit on the order of $1.9 trillion and faces nearly $1 trillion in annual interest costs, according to Congressional Budget Office projections. Those metrics are unaffected by a temporary ceasefire or brief changes in geopolitical risk.
The concept of fiscal dominance explains the long-run case: as debt and interest obligations grow, the Federal Reserve’s ability to sustain highly restrictive real rates is constrained because higher rates amplify debt-service burdens. That structural constraint tends to cap real yields over time and supports higher prices for non-yielding assets like gold.
Critics rightly note that if the Fed maintains a 3.50–3.75% policy rate through 2027, paper bullion faces headwinds. That is true for the interim; however, continued heavy Treasury issuance and rising debt service reduce the feasible duration of truly restrictive real yields. In other words, fiscal realities increasingly limit how long the restrictive rate regime can persist.
What Happens to Gold When the War Ends?
History suggests a likely path: when the supply shock to oil eases, headline inflation pressures subside, market participants rebuild rate-cut expectations, real yields compress, and paper gold tends to recover quickly. Analysts have estimated a substantial “suppression” effect on gold prices tied to the war and energy spike. Once oil declines and the Fed is expected to ease, a large portion of that gap can close.
Silver’s behavior already illustrates this dynamic: from a war low of about $61 in late March, silver climbed to roughly $79.90 by April 21 — a roughly 31% rebound that outpaced gold and tightened the gold-silver ratio from near 90x toward the long-run mean around 60x. That move underscores how quickly the market can reposition when real-yield pressure diminishes and industrial demand remains resilient.
Near-term catalysts to watch include ceasefire developments, Federal Reserve meetings and key inflation expectation prints. A durable ceasefire, sustained declines in oil, and renewed rate-cut expectations create the clearest pathway back to the pre-war price levels for paper gold and further gains for physical and industrial precious metals.
SOURCES
1. CME Group — CME FedWatch Tool
2. Congressional Budget Office — The Budget and Economic Outlook: 2026 to 2036
3. Congressional Budget Office — Director’s Statement on the Budget and Economic Outlook: 2026 to 2036
4. Kitco News — Daily Gold Market Reports
5. TradingEconomics — Gold Spot Price Historical Data
6. U.S. Energy Information Administration — Crude Oil and Petroleum Product Prices Increased Sharply in Q1 2026
By the GoldSilver Editorial Team — helping investors understand sound money since 2005. This article is for informational purposes only and does not constitute financial, investment, or tax advice. Always consult a qualified financial advisor before making investment decisions.
You May Also Like:
- What the Warsh Hearing Means for Gold Prices
- IMF Says Treasuries Aren’t Safe Anymore. Gold Noticed First.
- Gold Price After Ceasefire Violation: The Floor Has Moved
- Oil Crashed 11%. Gold Went Up. That Tells You Everything.
- $1 Trillion in Debt Interest Is Why Gold Keeps Climbing
- 5 Signals That Say Gold’s Bull Case Just Got Stronger
- The Largest Gold ETF Outflow Ever – But China Disagrees
- Silver Market Deficit 2026: Six Years and Getting Worse
Stay On Top of Gold & Silver Prices
Get important market alerts sent straight to your inbox.
Subscribe for free alerts and concise market updates on gold, silver, inflation, and monetary policy.
Popular Topics
Picked from the archive
-
01
 Topics
Serbia Repatriates USD 6B in Gold Reserves From Overseas Vaults
-
02
Topics
How Real Interest Rates Drive Gold Prices: Investor Guide
-
03
Topics
Gold Prices Slip After Rally as Fed Rate Cut Looms
-
04
Topics
Gold Rises Amid Fed Uncertainty, Weak Jobs and Crypto Turmoil
-
05
Topics
Why BRICS Nations Are Stockpiling Gold
-
06
Topics
High Earners Falling Behind on Credit Cards and Auto Loans
-
07
Topics
Gold Prices Slip as Fed Officials Delay December Rate Cut
-
08
Topics
Extra $21 Billion in Tariff Revenue Fails to Stem the Deficit