Gold Price Support Shifts After Ceasefire Violation

Gold and Silver market update — April 20, 2026
Key Takeaways
- The US Navy seized the MV Touska, oil jumped about 7%, and gold fell only roughly 1% — a much smaller reaction than earlier escalations, suggesting the market’s floor has structurally shifted.
- Gold is increasingly priced as a monetary hedge rather than purely a geopolitical safe haven. The main driver is fiscal dominance: US debt interest is crossing $1 trillion, the Fed has posted operating losses for three consecutive years, and central banks are accelerating de-dollarization.
- The bullish case for gold no longer requires the war to end; it relies on the Federal Reserve remaining trapped between inflationary pressures and rising debt service. That constraint is persistent.
- Major bank price targets for gold in 2026–2027 cluster far above current levels: Goldman Sachs $5,400 (year-end), J.P. Morgan $6,300, Deutsche Bank $6,000, Bank of America $6,000, Wells Fargo Investment Institute $6,100–$6,300, Société Générale $6,000.
On Sunday morning a US Navy destroyer, the USS Spruance, fired on and seized an Iranian-flagged vessel in the Gulf of Oman. The Strait of Hormuz — the choke point for roughly 20% of the world’s seaborne oil — effectively closed again. WTI and Brent futures surged, stock futures fell, and gold slipped only about 1%.
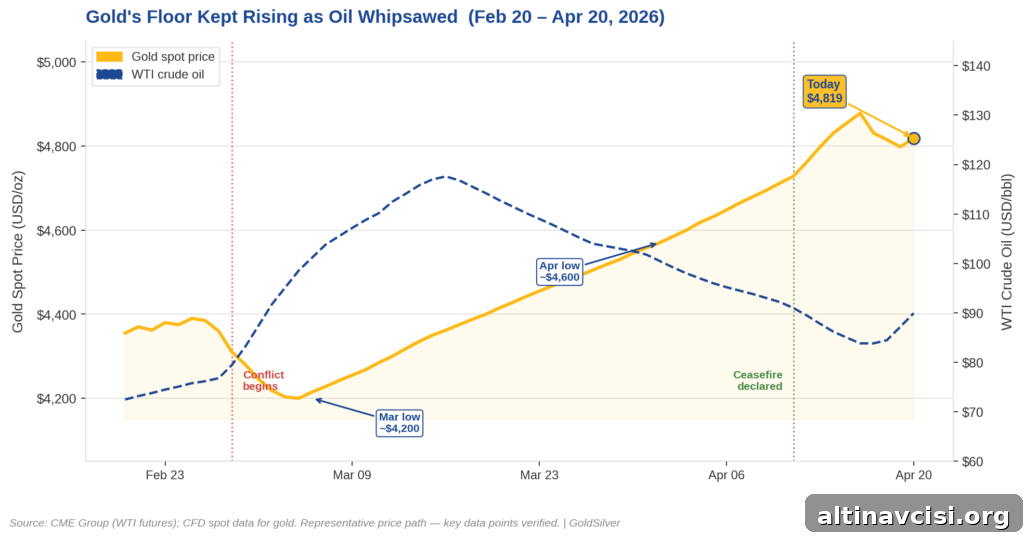
Gold did not undergo the sharp sell-off seen during earlier spikes in geopolitical risk. Monday opened with gold around $4,819 per ounce, holding a floor that did not exist in February. The more relevant question is not why gold fell slightly, but why it didn’t fall further.
Where Is the Gold Price Right Now?
Gold: approximately $4,819/oz, down ~1% from last Friday’s close of $4,831. Silver: about $80.13/oz, down roughly 2%. Gold–silver ratio: 59.7, indicating a mild safe-haven rotation into gold while silver underperforms. The US dollar index (DXY) is up modestly near 98.29. WTI crude trades around $89–$90 per barrel. In this episode, oil is the headline and gold is the signal.
What Happened Over the Weekend?
The weekend followed a pattern already seen this spring: short-lived optimism followed by re-escalation. On Friday Iran announced a 10-day ceasefire and declared the Strait “completely open,” sending oil sharply lower, equities to new highs, and gold to an intraday peak near $4,878.
By Saturday that optimism unraveled. Diplomatic conditions such as lifting a naval blockade proved non-negotiable, Iranian attacks on shipping resumed, and on Sunday the US Navy intercepted the MV Touska. This marked the first ship seizure in the current conflict, and oil prices reacted strongly.
Sunday evening market moves: WTI +7.14% to $89.94/bbl; Brent up roughly 6% to $95.71; S&P 500 futures down about 0.67%; Dow futures down ~0.88%; gold down ~1%.

The Edge Every Investor Needs
Smarter precious metals investing starts here. The Nuggets Newsletter delivers concise market insights, Fed updates, global trends, and practical education.
Why Isn’t Gold Falling More When Oil Spikes?
A typical chain reaction from a large oil shock would push the dollar higher, lift inflation expectations, force the Federal Reserve into more hawkish language, raise yields, and put pressure on gold. Additionally, margin calls historically force some investors to liquidate gold to cover losses elsewhere. That pattern played out in March 2026 when gold fell 2–3%.
This time, gold only fell about 1% and held above $4,800. The market is increasingly pricing gold for a different regime: not merely as a short-term geopolitical hedge but as protection against monetary and fiscal risks that threaten paper money’s purchasing power.
What is fiscal dominance — and why does it matter for gold?
Fiscal dominance occurs when government debt and associated interest costs become so large that the central bank’s policy choices are constrained. The Fed currently maintains a target range of 3.50%–3.75%, and front-month pricing (as of April 17, 2026) put the chance of no rate change at the April 28–29 meeting near 97.9%.
Several facts illustrate the fiscal constraint: the Fed posted $18.7 billion in operating losses for 2025 — the third consecutive annual operating loss — bringing cumulative operating losses to about $210.3 billion. The Fed can no longer remit profits to the Treasury, ending a stream of historical remittances that topped $1 trillion over time. Meanwhile, US interest payments on the national debt are crossing $1 trillion this fiscal year, a burden larger than the entire defense budget.
That math matters for gold. The Fed cannot raise rates freely without dramatically increasing the Treasury’s interest bill. It also cannot cut aggressively while inflation remains elevated — March 2026 CPI ran 3.3% year-over-year — and persistent oil strength would make easing politically and economically risky. Those constraints create a structural floor under gold that is independent of short-term geopolitical headlines.
What Are the Big Banks Forecasting for Gold in 2026?
Major Wall Street forecasts reflect the same fiscal math. Goldman Sachs set a year-end 2026 gold target of $5,400 in January and reaffirmed it after March’s volatility. Bank of America, Wells Fargo Investment Institute, Deutsche Bank, and Société Générale have issued 2026–2027 price ranges clustered near $6,000. J.P. Morgan expects roughly 800 tonnes of official-sector gold purchases in 2026, about double the pre-2022 pace.
Central banks buying gold are signaling with their balance sheets — a deliberate move away from reliance on paper currency systems.
Has the Gold Price Floor Permanently Shifted Higher?
The gold floor today is less about whether the Strait of Hormuz is open and more about whether central banks and governments are fiscally constrained. At present, those constraints are real. The Fed cannot raise rates without escalating the Treasury’s interest burden, nor can it cut materially until inflation is clearly under control. In that environment, gold benefits from either rising or sticky rates because it serves as an alternative store of value.
Gold traded near $4,300–$4,400 before the recent conflict. The March low was around $4,200; the April low around $4,600; this morning gold traded near $4,784. Each pullback has found a higher base. China’s central bank (PBoC) has been a net buyer for many months, and some European central banks have repatriated or reallocated holdings — actions that tighten physical supplies available to the investment market.
The recent ship seizure is a headline. The longer-term story is the repricing of gold in a world where fiscal dominance limits policy flexibility and central banks are diversifying reserves. That dynamic supports gold’s role as a monetary hedge rather than only a short-term geopolitical asset.
What Should Gold Investors Watch This Week?
Pakistan talks (Tuesday): Any credible ceasefire news could briefly push gold down 1–2%, but the longer-term monetary math remains unchanged.
FOMC meeting (April 28–29): A rate hold is nearly certain; focus on how Chair Powell balances inflation against growth. Any signal about timing for 2026 cuts will move markets.
$4,750 support: Treat $4,750 as the new structural floor. A sustained daily close below that level would indicate the floor is weakening.
WTI above $85: If oil remains elevated through the Fed meeting, the “higher for longer” narrative for rates becomes more entrenched, reinforcing the case for physical gold as an alternative to cash.
SOURCES
- U.S. Energy Information Administration — report on the Strait of Hormuz as a critical oil chokepoint.
- CME Group — gold, WTI, and Brent futures quotes and the CME FedWatch tool.
- Reuters reporting on Fed commentary and timing of rate cuts.
- Federal Reserve releases — FOMC materials, H.4.1 report on reserve balances, and the 2025 Monetary Policy Report.
- Congressional Budget Office — Budget and Economic Outlook: 2026 to 2036.
- Peter G. Peterson Foundation — monthly tracker on interest costs of the national debt.
- U.S. Bureau of Labor Statistics — Consumer Price Index, March 2026.
- J.P. Morgan Global Research — analysis and forecasts for gold demand and official sector purchases.
- World Gold Council — updates on China’s gold demand and global trends.
By the GoldSilver Editorial Team — helping investors understand sound money since 2005. This article is for informational purposes only and does not constitute financial, investment, or tax advice. Consult a qualified financial advisor before making investment decisions.
You May Also Like:
- Oil Crashed 11%. Gold Went Up. That Tells You Everything.
- $1 Trillion in Debt Interest Is Why Gold Keeps Climbing.
- Five Signals That Strengthen Gold’s Bull Case.
- The Largest Gold ETF Outflow Ever — But China Disagrees.
- Silver Market Deficit 2026: Six Years and Getting Worse.
- Is the Petrodollar Ending? What the Iran War Means for Gold.
- France’s Gold Repatriation Is Complete; Germany Could Be Next.
- Gold/Silver Ratio Hits 61.1 — Is Silver Due to Run?
Popular Topics
Picked from the archive
-
01
 Topics
Why Central Banks Are Buying Gold Again and What It Means
-
02
Topics
ETF Inflows Propel Gold Demand to Highest H1 Levels Since 2020
-
03
Topics
Why Silver Is Leaving COMEX Vaults and What Investors Overlook
-
04
Topics
Ray Dalio: Why Allocate 15% to Gold or Bitcoin
-
05
Topics
Gold Drops 1.5% After Fed Holds Rates Steady
-
06
Topics
Gold Price: What Could Drive It to $6,300?
-
07
Topics
Gold Market Cycles: Investor Lessons from Past Bull Runs
-
08
Topics
Kansas City Fed President Urges Steady Rates Amid High Inflation