Silver Market Faces Sixth Year of Growing Deficit in 2026
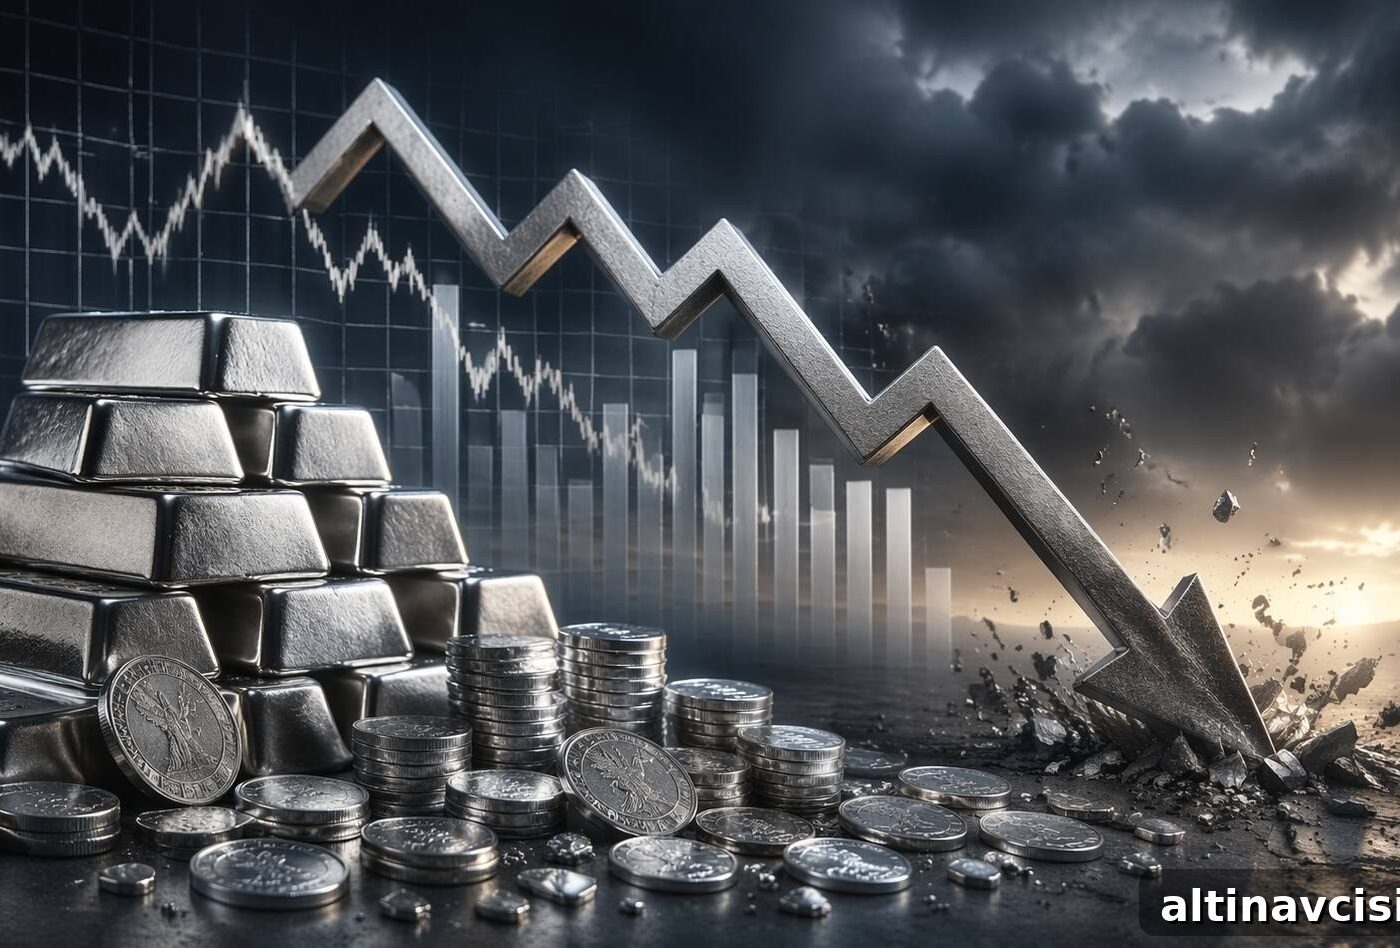
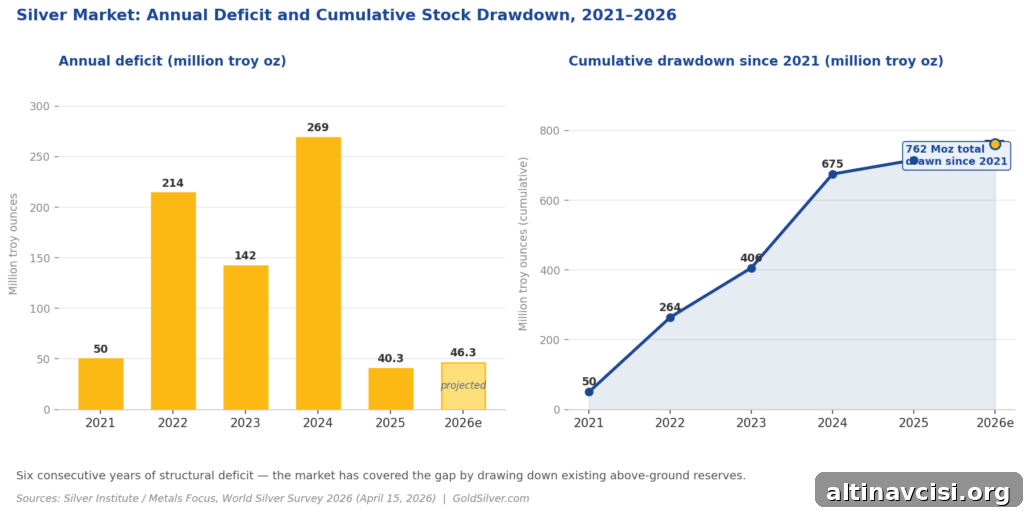
The global silver market is projected to record its sixth consecutive annual supply deficit in 2026, with a shortfall of 46.3 million troy ounces, according to the World Silver Survey 2026 published by the Silver Institute and Metals Focus on April 15, 2026. Since 2021 the market has drawn down a cumulative 762 million troy ounces from above-ground stocks to meet demand — a pace of reserve depletion with no modern precedent.
Silver’s price has fallen roughly 35% from its January 29, 2026 record high of $121.62 per ounce, and that decline dominates headlines. Yet the deeper story is the sustained drawdown of inventories over multiple years to cover a persistent supply shortfall. Prices and physical market balances are telling two different parts of the same story: the headline price is lower, but the underlying physical market is materially tighter.
What is the silver market deficit in 2026?
The 2026 silver market deficit is forecast at 46.3 million troy ounces — a 15% increase from the 40.3 million-ounce deficit recorded in 2025. This marks the sixth year in a row in which total global silver demand has exceeded total supply, per the World Silver Survey 2026. Notably, the deficit is widening even though total demand is expected to decline by about 2% in 2026; the explanation is that supply is falling faster than demand.
Total global silver supply is also forecast to decline by roughly 2% in 2026 as producer hedging activity normalizes after an abrupt increase in the second half of 2025. When both demand and supply contract but the shortfall grows, it signals a tightening physical market rather than loosening conditions. That tightening occurs because the pool of immediately available metal shrinks faster than demand softens.
Why does the silver deficit keep widening?
Silver serves two distinct and sometimes opposing roles: an essential industrial metal and a monetary/store-of-value metal. Industrial demand is structural and often inelastic — silver is critical in solar panels, electric vehicle components, semiconductors, and other high-tech applications where substitutes are limited. At the same time, investors buy and hold silver as a monetary asset or hedge. When industrial consumption and investment demand rise together, supply struggles to keep pace.
A structural deficit means that total demand persistently exceeds total supply over multiple years. Unlike a temporary shortage, it does not typically correct quickly because the drivers — steady industrial consumption, constrained mine output — are slow to change. A key reason supply is rigid is that most silver is produced as a byproduct of mining for gold, copper, and zinc; raising silver production significantly often requires investment in those other metal operations rather than direct silver-focused mines. Higher silver prices alone do not automatically translate into large new mine supply.
When the market is short, it does not instantly stop servicing demand. Instead, it taps above-ground stocks: metal held in exchange vaults, institutional reserves, and dealer inventories accumulated over decades. Since 2021 those above-ground stocks have been reduced by roughly 762 million troy ounces, according to the Silver Institute’s analysis. Running a market from reserves for multiple years raises the question: how long can those buffers continue to be drawn down?
What happened in the London silver market in 2025?
In September 2025 the share of silver in London vaults that was unencumbered — meaning not tied up in exchange-traded products and therefore available for immediate delivery — fell to a historic low of about 17%. That scarcity helped trigger a physical liquidity squeeze in October 2025, which pushed lease rates sharply higher, according to Philip Newman, Managing Director at Metals Focus, in the World Silver Survey 2026.
At the time of the squeeze London vaults held roughly 884 million troy ounces of silver in total, but only around 17% of that (approximately 150 million ounces) was free to move. By end-March 2026 the unencumbered share had recovered to roughly 28% — the highest level since January 2025 — but that recovery is fragile. Additional waves of physical buying from major markets, renewed inflows into London-based exchange-traded products, or a sharp price move could quickly recreate squeeze conditions. This is not conjecture; it is the arithmetic of a market running a multi-year deficit.
Why is silver’s price down while the deficit is getting worse?
Silver was trading near $80 per ounce at the time of reporting — about 35% below its all-time high of $121.62 set on January 29, 2026. The physical market, however, is materially tighter than it was when silver traded at much lower levels. Short-term prices are driven by financial market forces: futures positioning, exchange-traded product flows, currency (dollar) strength, and risk sentiment related to geopolitical events. Those factors can push price temporarily in either direction, masking slower-moving structural supply-demand trends.
One stark indicator of tightening is COMEX registered silver inventories, the exchange’s measure of metal actually available for futures delivery. Registered inventories have fallen by roughly 75% since 2020, declining from around 346 million ounces to approximately 88 million (COMEX data, February 2026). At the same time, retail coin and bar demand is forecast to rise about 18% in 2026, driven in part by renewed U.S. retail interest. That combination — fewer deliverable stocks and recovering retail demand — increases the risk of tighter physical conditions even if paper-market prices fall.
A 35% price decline in an asset with deteriorating physical fundamentals can be interpreted either as a warning sign or as a buying opportunity, depending on an investor’s time horizon and risk tolerance.
What does the silver deficit mean if you own physical silver?
The World Silver Survey provides a clear set of data points that form the bullish case for physical silver: six consecutive annual deficits, ongoing industrial demand that is difficult to replace, substantial inventory drawdown, and a still-compressed gold-to-silver ratio. The gold-to-silver ratio referenced in the survey sits near 61:1, which remains well below the extreme levels seen in April 2025 when the ratio exceeded 100:1.
The structural thesis does not require an immediate price spike. Instead, it relies on the persistence of the deficit and the continued erosion of the physical buffer that has masked shortages. In practical terms, the case for holding physical silver looks like this:
- Structural annual deficit: Total demand has exceeded total supply every year since 2021.
- Essential industrial demand: Silver is irreplaceable in many solar, EV, semiconductor, and emerging technology applications.
- Compressed valuation relative to gold: A gold-to-silver ratio around 61:1 compared with far higher extremes seen during dislocations.
- Recovering retail demand: Coin and bar purchases are forecast to rise, supporting physical uptake even as exchange inventories decline.
This is not a speculative fear argument but a supply-and-demand assessment based on research from major industry sources. For owners of physical metal, the key takeaway is that structural tightness raises the risk that future demand shocks will translate into price volatility and potential delivery pressures.
Stay On Top of Gold & Silver Prices
Sign up for market alerts and essential updates for precious metals investors.
SOURCES
Silver Institute / Metals Focus — World Silver Survey 2026
GlobeNewswire reporting on Silver Institute commentary (April 2026)
Silver Institute — analysis of global silver investment and market deficits (April 2026)
CME Group — COMEX warehouse stock data (February 2026)
Metals Focus — World Silver Survey and market commentary
By the GoldSilver Editorial Team — helping investors understand sound money since 2005. This article is for informational purposes only and does not constitute financial, investment, or tax advice. Consult a qualified financial advisor before making investment decisions.
You May Also Like:
- Is the Petrodollar Ending? What the Iran War Means for Gold
- France’s Gold Repatriation Is Done. Germany Is Next
- Gold/Silver Ratio Hits 61.1 — Silver’s Turn to Run
- Silver Holds Near $80 as Geopolitical Events Affect Markets
- The Fed Goes Silent — What It Means for Gold
- Gold Is Down from War-Peak Levels but Still Up Substantially Year-on-Year
- Gold Outranks the Dollar at Central Banks — Implications for Savings
Popular Topics
Picked from the archive
-
01
 Topics
Gold Up 3% and Silver 7% as Metals Rally to End Q1
-
02
Topics
Tariff Deadline Sends Copper Prices 40% Higher in 2025
-
03
Topics
Why Big Banks Predict Gold Prices Over $6,000
-
04
Topics
Gold Price Reaction to Jobs Report – Pre-Market Guide
-
05
Topics
Middle East Tensions Lift Gold Prices; Platinum Hits 2021 High
-
06
Topics
How Government Debt Drives Gold and Silver Prices
-
07
Topics
U.S. Debt Tops $38T; J.P. Morgan Forecasts Gold Above $5,000
-
08
Topics
COMEX Silver First Notice Day: Key Events to Watch April 30