Updated 2026 Gold Price Outlook After Q1
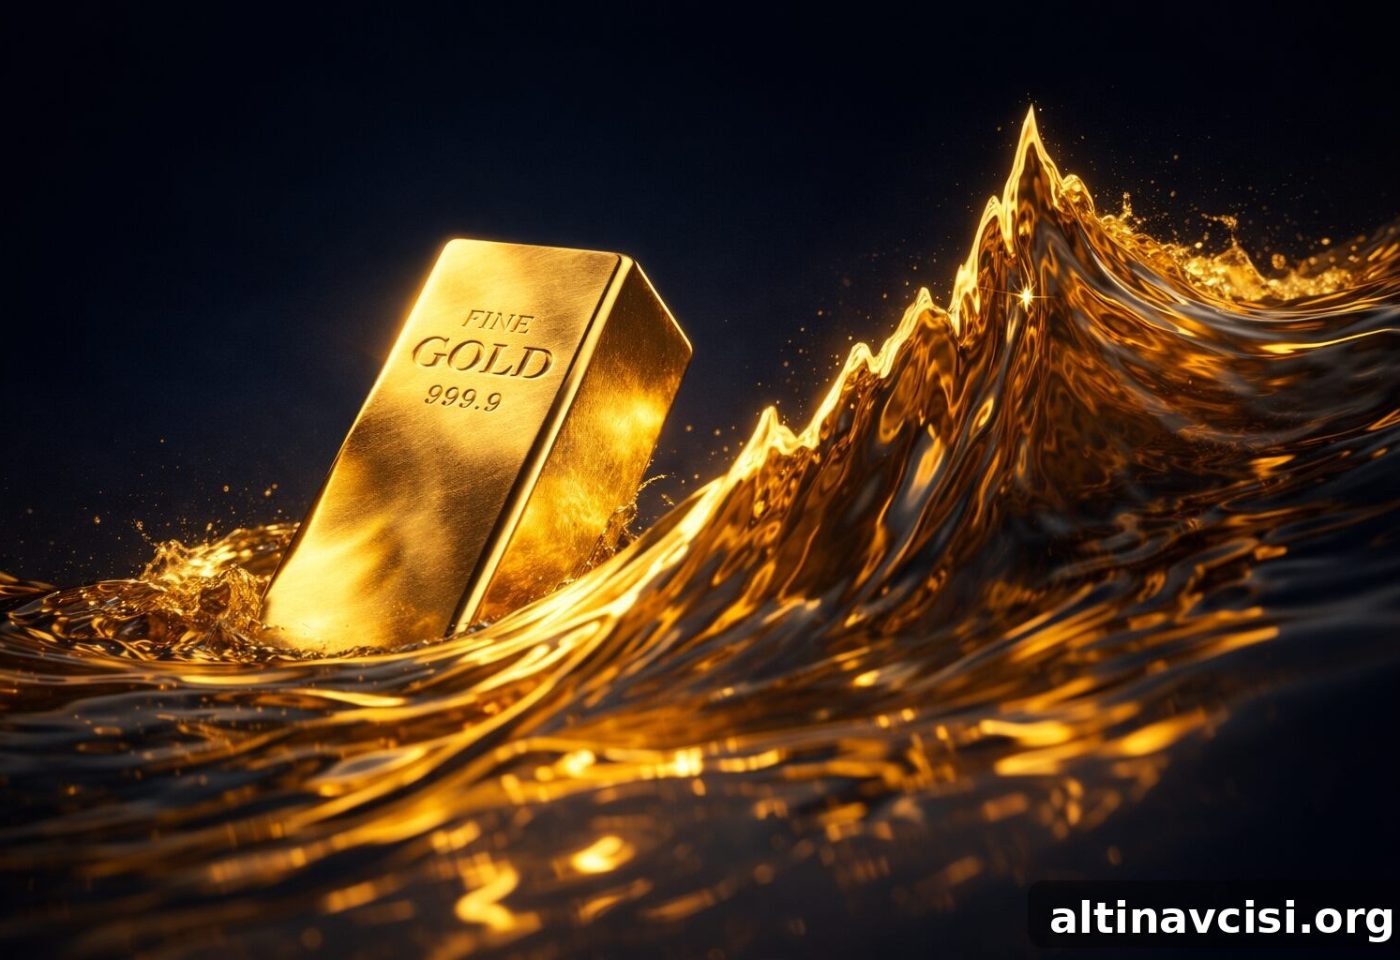
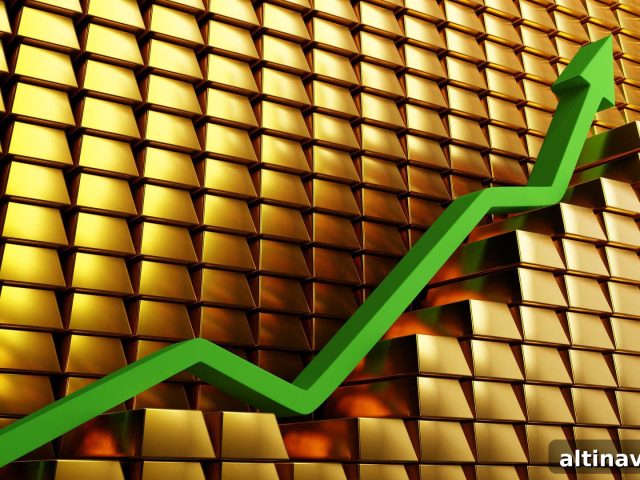
Gold’s performance in 2026 has been far more dramatic than many full years. The metal climbed past $5,000 per ounce for the first time in history and reached an all-time intraday high of $5,589.38 on January 28. By the end of Q1, however, gold had fallen back to close around $4,503 — a modest year-to-date gain of about 3.1% that belies how volatile the quarter really was [GoldSilver.com].
That contrast — an extreme peak followed by a sharp retreat — defined Q1 and has already forced major institutions to revise their 2026 year-end forecasts, both upward and downward.
What Happened in Q1 2026
Gold opened the year near $4,384 and climbed steadily through January, supported by a weaker U.S. dollar, steady ETF inflows, and ongoing geopolitical uncertainty. That momentum culminated in the January 28 record when gold traded above $5,500 for the first time in history. The rally reflected a mix of currency depreciation, investor demand for safe-haven assets, and elevated risk premiums in global markets.
The subsequent pullback was swift. By late March, the price had retreated into the $4,300–$4,500 range. The decline was driven by rising inflation expectations after energy price shocks, which reduced the likelihood of near-term Federal Reserve rate cuts and increased the opportunity cost of holding a non-yielding asset like gold. A broader equity sell-off also triggered some liquidation of gold positions as investors covered losses in other parts of their portfolios.
Q1’s trading range — roughly $4,100 at the low to nearly $5,600 at the high — was extraordinary by historical standards. Still, gold maintained its key technical support levels during the selloff, a point analysts highlight as evidence of persistent underlying demand [GoldSilver.com].
How the Major Forecasts Have Shifted
Q1’s volatility prompted outlook revisions across banks and research firms. Some raised their near-term targets in response to the record highs and renewed central bank buying, while others lowered forecasts after the rapid pullback. The table below summarizes several notable changes.
| Analyst / Firm | Original Target | Revised Target | Direction |
| UBS | $4,500 – $4,900 | $6,200 (by Sept 2026); upside to $7,200 | ↑ |
| ANZ Bank | $4,600 | $5,800 (Q2 2026) | ↑ |
| Société Générale | $5,000 | $6,000 | ↑ |
| Deutsche Bank | $6,000 | $6,000 (reiterated Feb 2026) | → |
| Yardeni Research | $6,000 | $5,000 (lowered); $10,000 by decade-end | ↓ near-term |
| JP Morgan | $6,300 | ~$5,000 by Q4 2026 (base case); $6,000+ longer term | ↓ near-term |
| State Street Global Advisors | $4,000 – $5,000 | $4,750–$5,500 base case; $5,500–$6,250 bull case | ↑ |
Sources include Scottsdale Bullion & Coin, JP Morgan Global Research, and State Street’s Monthly Gold Monitor for March 2026.
Yardeni Research’s revision was among the most discussed: the firm lowered its year-end 2026 target from $6,000 to $5,000, citing the Q1 correction, while simultaneously projecting a much higher end-of-decade target. Their view signals near-term consolidation but a continued belief in a long-term structural bull market for gold. By contrast, UBS raised its near-term target to $6,200 by September 2026, with upside to $7,200, representing one of the more aggressive bank forecasts for this cycle.
JP Morgan softened its short-term outlook as well, now framing a base-case scenario of around $5,000 by Q4 2026. That base case assumes sustained quarterly demand from central banks and investors while acknowledging $6,000+ remains feasible over a longer horizon [JP Morgan Global Research].
What to Watch for the Rest of 2026
The central question for the remainder of 2026 is whether gold can reclaim and hold the $5,000-per-ounce level. State Street identifies $4,400–$4,600 as strong near-term support and assigns roughly a 50% probability to a base-case range of $4,750–$5,500, with a 35% probability that prices could move into a bull case of $5,500–$6,250 [State Street Global Advisors].
Key downside risks remain: a Fed that pivots back toward tightening, a strong and sustained U.S. dollar rally, or reduced geopolitical risk premiums could all pressure gold prices. Still, after a quarter in which gold hit an all-time high, then corrected while holding technical support, many analysts believe the longer-term structural bullish case is intact.
People Also Ask
What was the gold price high in Q1 2026?
Gold reached an intraday record of $5,589.38 per ounce on January 28, 2026 — the first time it traded above $5,500. It later retreated and closed Q1 at roughly $4,503 per ounce.
Why did gold pull back after the all-time high?
The correction followed a rise in inflation expectations tied to energy price shocks, which reduced the probability of imminent Fed rate cuts and increased the opportunity cost of holding gold. A simultaneous equity market pullback also caused some investors to liquidate gold holdings to meet margin calls or offset losses elsewhere.
Have gold price forecasts changed since Q1 2026?
Yes. Several major institutions updated their outlooks: UBS raised its near-term target to $6,200, ANZ moved to $5,800 for Q2, Société Générale increased its target to $6,000, while Yardeni Research trimmed its 2026 year-end target to $5,000 but raised its decade-end forecast. JP Morgan now lists roughly $5,000 as a base case for Q4 2026, with higher levels possible over a longer horizon.
Is $5,000 gold still realistic for 2026?
Many institutional forecasts still place year-end 2026 targets at or above $5,000. State Street’s base-case range and JP Morgan’s Q4 projection both suggest that $5,000 is achievable if central bank demand stays elevated and the dollar continues to trend lower [State Street] [JP Morgan].
SOURCES
1. GoldSilver.com — Gold vs. Stocks in 2026: What Q1 Returns Show
2. Investing News Network — Gold Price Update: Q1 2026 in Review
3. JP Morgan Global Research — Gold Price Forecast 2026 and Beyond
4. State Street Global Advisors — Monthly Gold Monitor, March 2026
5. Scottsdale Bullion & Coin — Gold Price Forecasts 2026
This article is for informational purposes only and does not constitute financial or investment advice. Always consult a qualified financial advisor before making investment decisions.
You May Also Like:
- How to Read the Gold-Silver Ratio — And What to Do About It
- Is a Policy Reversal Coming? What the Conflict Pressure Index Means for Gold
- Gold ETFs Are Booming. But Do You Actually Own Gold?
- Silver Demand by Sector: Industry, Jewelry & Investment
- Small Market, Big Swings: Why Silver Is More Volatile Than Gold
- 87% Dollar Devaluation Since 1971: Why Central Banks Keep Buying Gold
- How to Roll Over Your 401(k) Into a Gold IRA
Popular Topics
Picked from the archive
-
01
 Topics
Silver Slides While Gold Holds as Markets Reduce Risk
-
02
Topics
Trump Urges Rate Cuts While Fed Likely Holds Interest Rates
-
03
Topics
China Drives Gold Demand as Goldman Projects $4,000 Target
-
04
Topics
Will Policy Reversal Move Gold? Conflict Pressure Index Insight
-
05
Topics
Why Gold Moves Differently from Stocks and What It Means
-
06
Topics
Trump Imposes 25% Tariff on India’s Oil Imports From Russia
-
07
Topics
After Major Silver Price Crashes: What Investors Can Expect
-
08
Topics
War Risk and Stagflation Signal a 6,300 Gold Price Target