Gold and Silver Prices: Short-Term Volatility, Long-Term Trend
Every day the prices of gold and silver move — sometimes barely, sometimes sharply enough to make headlines. A stronger jobs report can push gold down. A geopolitical flare-up can send it higher. Silver can jump 4% in a session and then give back half of that gain.
If you watch prices daily, it can feel like financial whiplash. The natural reaction is to act: sell before it falls more, wait for a “better” entry, or question whether the investment thesis that seemed right last month still holds.
That impulse is understandable. It’s also what causes many investors to miss the biggest gains. The people who benefit most from precious metals aren’t those who react to every headline — they’re the ones who can tell noise from signal.
What Is “Noise” vs. “Signal” in Gold and Silver Prices?
In investing, noise describes short-term price swings driven by emotion, speculation, or temporary events. These moves can feel important in the moment but rarely determine long-term outcomes. Signal reflects deeper structural forces — inflation cycles, real interest rate trends, currency debasement, central bank behavior, and systemic financial stress — that evolve over years and shape multi-year returns.
Gold and silver generate a lot of noise:
- A Federal Reserve press conference.
- A monthly CPI report.
- A sudden currency swing.
- A geopolitical incident.
Those events can move prices within hours. For long-term investors — those thinking in 5-, 10-, or 20-year horizons — the structural backdrop is what matters most, and it changes much more slowly than daily price charts suggest.
The Financial System Isn’t Safer — And You Know It
As risks mount, see why gold and silver are projected to keep shining in 2026 and beyond.
What Drives Short-Term Price Fluctuations?
Most daily moves follow a handful of recurring forces. Macroeconomic data — jobs reports, CPI, GDP — triggers rapid repositioning by traders. Strong numbers often pressure gold as investors rotate into risk assets, even if the longer-term inflation outlook hasn’t changed. Federal Reserve signals work the same way: rising rate expectations can push gold down short-term, though that relationship can reverse over full economic cycles.
Currency movements add another layer. Because gold is priced globally in U.S. dollars, a stronger dollar can push dollar-denominated prices lower even when physical demand remains solid. Futures markets and large leveraged positions on exchanges can amplify swings that have little to do with physical supply and demand. Geopolitical shocks can spike prices quickly and then partially retrace as tensions ease.
Silver responds to all these forces and more. Its substantial industrial use in electronics, solar panels, and medical applications makes silver more economically sensitive than gold, so it tends to move more dramatically in both directions.
These forces are real and they move prices. They just don’t define long-term outcomes.
The Long-term Signals that Matter
While traders react to the latest data release, the structural forces shaping precious metals over full economic cycles move much more slowly — and they’re far more consequential. The most reliable of these is real interest rates. When inflation-adjusted returns on cash and bonds turn negative, savers lose purchasing power by staying in conventional assets, and gold becomes more attractive as a store of value.
Currency debasement is another long arc: fiat currencies have lost purchasing power across decades, while gold has historically preserved value. That’s not a quarterly thesis — it’s a multi-generational one. Central bank behavior reinforces this signal: many central banks have been net buyers of gold for years, reflecting a structural shift in reserve preferences rather than a reaction to a single economic report.
For silver, the long-term tailwind includes the global energy transition. Electrification and expanding solar infrastructure require meaningful amounts of silver, and that growing industrial demand acts as a sustained support for prices. Underpinning all of this is confidence in the financial system: when doubts about debt sustainability, banking stability, or monetary policy credibility grow, precious metals tend to benefit. These shifts unfold over years, not news cycles.
The 1970s: A Masterclass in Volatility — and Conviction
The 1970s illustrate how volatility doesn’t invalidate a long-term bull market. Between 1971, when the U.S. ended the gold window, and 1980, gold climbed from roughly $35 per ounce to over $800; silver rose from about $1.50 to nearly $50. Those multi-year gains were punctuated by painful drawdowns.
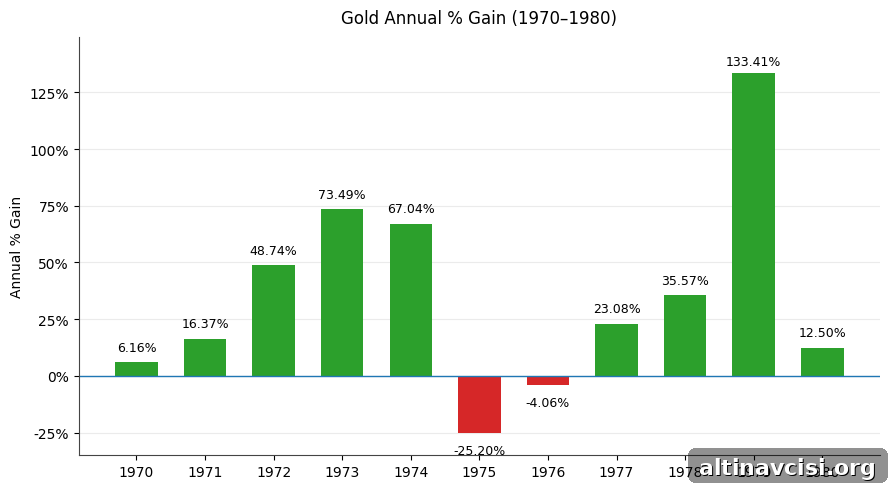
Gold delivered uneven annual returns, and mid-decade declines likely forced many investors who bought near peaks to sell at losses. The reward for those who held through the volatility included enormous single-year gains later in the decade.
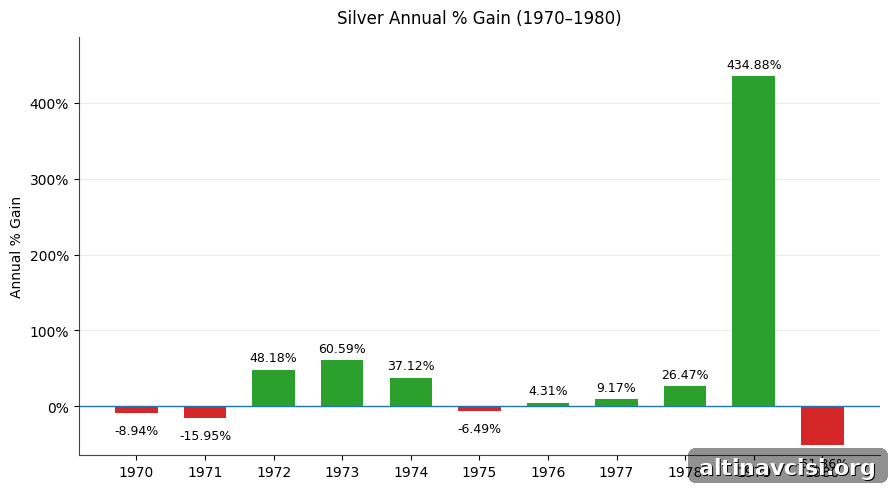
Silver was even more volatile: years of negative returns were followed by spectacular one-year rallies. Investors who abandoned their positions during down stretches didn’t just miss modest rebounds; they missed the decade’s defining gains. The lesson is clear: short-term noise can cost long-term investors the payoff they expected.
How Long-Term Investors Can Tune Out the Noise
If your objective is wealth preservation, portfolio diversification, or inflation protection, your behavior should match your time horizon. Practical steps include:
- Stop obsessing over daily prices: Checking gold prices every morning is like checking the weather every five minutes — it doesn’t change the climate.
- Align strategy with purpose: Are you trading short-term moves or hedging long-term monetary risk? Your approach should match your objective.
- Use dollar-cost averaging: Regular accumulation smooths volatility and reduces the urge to time the market.
- Set allocation intentionally: Conservative investors often keep 5–10% exposure to gold; those seeking higher upside may allocate more to silver, accepting greater swings.
- Focus on structural data: Monitor real rates, inflation trends, central bank buying, and debt dynamics rather than chasing headlines.
The Bottom Line: Volatility Is the Price of Conviction
Gold and silver have always been volatile. That’s not a flaw — it’s the nature of assets that exist partly outside the conventional financial system and react to long-term forces many investors overlook.
The daily noise — the Fed statement, the jobs report, the geopolitical headline — will always be present. None of it changes the structural backdrop: real rates, currency debasement, central bank behavior, and confidence in the financial system evolve slowly and determine cycle outcomes. Investors must decide whether their choices are driven by this morning’s price chart or by the forces shaping the next decade. For those focused on preserving purchasing power across cycles, volatility is not something to fear; it’s the cost of admission.
Stay On Top of Gold & Silver Prices
Get important market alerts sent straight to your inbox.
People Also Ask
What is the difference between short-term noise and long-term signals in gold and silver prices?
Short-term noise is price movement driven by temporary events — Fed remarks, economic releases, or geopolitical shocks — that often reverse quickly and have limited predictive value. Long-term signals are structural: inflation trajectories, real interest rates, currency trends, and central bank behavior that play out over years. Investors who react to noise often get shaken out before the structural signal produces the payoff.
What factors cause short-term volatility in gold and silver prices?
Short-term volatility stems from central bank policy signals, macro data releases (CPI, jobs, GDP), U.S. dollar swings, geopolitical events, and speculative futures activity. Silver is additionally sensitive to industrial-demand news, which amplifies its moves relative to gold.
Why are gold and silver considered long-term investments?
Historically, gold and silver have preserved purchasing power across long spans of inflation, currency debasement, and financial crises. Their low correlation with stocks and bonds makes them effective diversifiers. Their value tends to compound across economic cycles rather than over single years, so patience often matters more than timing.
How do macroeconomic conditions impact gold and silver prices over time?
The most important macro driver is real interest rates: when inflation-adjusted returns on cash and bonds are negative, gold’s appeal as a store of value rises. Persistent inflation erodes fiat purchasing power, benefiting both metals. Over longer horizons, structural trends like central bank reserve accumulation and increasing industrial silver demand add compounding pressure that daily headlines rarely capture.
How can investors identify meaningful trends in gold and silver markets?
Focus on structural indicators rather than daily price moves: real (inflation-adjusted) interest rates, central bank reserve changes, inflation trajectory, and long-term currency trends. For silver, tracking the gold-to-silver ratio can offer perspective; historically, very high ratios have preceded periods of silver outperformance. Dollar-cost averaging and a multi-year horizon help keep decisions anchored to fundamentals instead of headlines.
Disclaimer: This article is for informational purposes only and does not constitute investment advice. Consult a qualified financial advisor before making investment decisions. Past performance is not indicative of future results.
You May Also Like:
- Silver Canadian Maple Leaf: Why it’s one of the world’s top bullion coins
- Gold portfolio allocation 2026: What major bank forecasts may mean for investors
- How government debt affects gold and silver
- Gold vs. silver: The liquidity difference that matters
- Silver price components: premium, spot, and dealer markup explained
Popular Topics
Picked from the archive
-
01
 Topics
June CPI Jumps 2.7 Percent as Tariffs Push Up Consumer Prices
-
02
Topics
Gold Prices Rise as Dollar Slips Ahead of Fed Rate Decision
-
03
Topics
Gold Purity Guide for Investors: Karats, Fineness and Value
-
04
Topics
Gold Prices Surge as Middle East Tensions Escalate
-
05
Topics
Russia Taps $1B Chinese Gold Market Amid Geopolitical Shift
-
06
Topics
Gold’s Bull Run: Fed Rate Cuts and China Buying Drive $5K Target
-
07
Topics
Treasury Yields Jump After May Inflation Tops Estimates at 2.7%
-
08
Topics
5 Factors That Drive Gold Spot Prices