

Gold fell to $4,304 on September 23, 2026, and silver declined about 3% to $65. Many headlines blamed hawkish Federal Reserve comments and a firmer dollar, naming officials who spoke that day. Those factors mattered, but they were not the direct driver of the price move.
The key number was the 10-year real yield, which jumped 13 basis points on the same day. If you do not know how to check that figure yourself, you’re relying on secondhand interpretations shaped by whoever wrote the headline. Below is a clear, practical explanation of which indicators matter for gold and how you can verify them yourself using public data.
Key Takeaways:
- Gold’s most consistent macro driver is the real 10-year Treasury yield (TIPS yield), not the nominal 10-year yield or the Fed funds rate.
- From September 8 to September 23, 2026, nominal 10-year yields rose about 31 basis points while real yields rose about 33 basis points and breakeven inflation barely changed. This month’s move is largely a real-rate story, not an inflation story.
- Real yields are positive and rising (2.76% on September 23, 2026), which is a different environment than the negative-real-yield, “financial repression” regime of 2020–2022.
- The three series you can check for yourself—nominal 10-year yield, real 10-year (TIPS) yield, and the 10-year breakeven inflation rate—are public and updated daily on the Federal Reserve Bank of St. Louis data portal.
What’s the Difference Between the Nominal and Real 10-Year Yield?
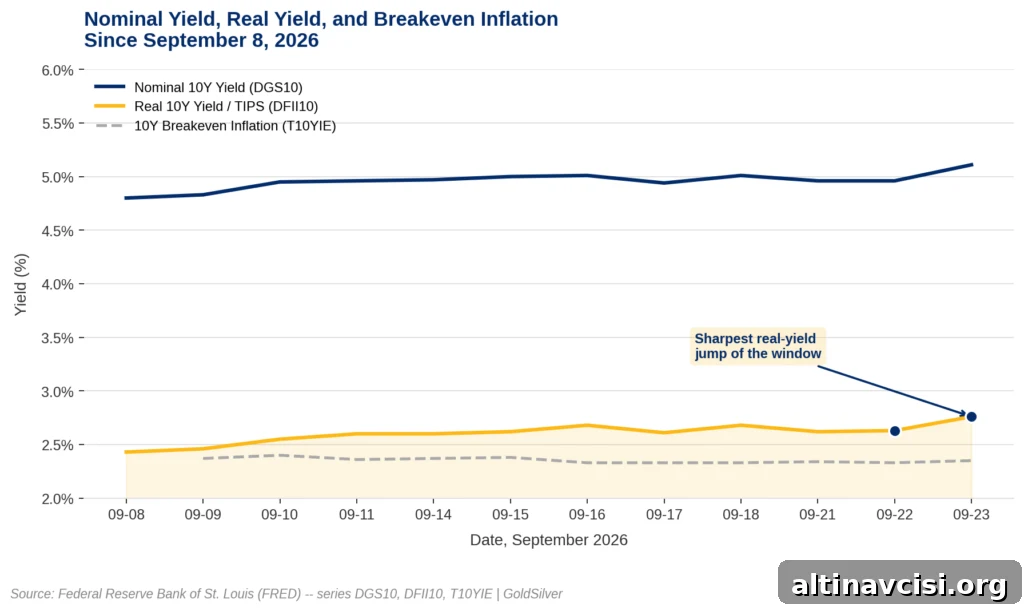
There isn’t a single “10-year Treasury yield”—there are at least two commonly referenced yields that answer different questions. The nominal 10-year yield is the interest rate printed on a standard Treasury bond. The real 10-year yield is the yield on Treasury Inflation-Protected Securities (TIPS); it reflects the return after removing the inflation premium.
On September 23, 2026, the nominal 10-year yield closed near 5.11%, up roughly 31 basis points from September 8. The real 10-year yield (the TIPS rate) closed near 2.76%, up about 33 basis points over the same span. The difference between those two yields—the breakeven inflation rate—is the market’s expectation for average inflation over the next decade. In this period, breakeven inflation moved only marginally, meaning the change in yields was overwhelmingly a real-rate story.
Put simply: nominal yields rose, real yields rose by about the same amount, and inflation expectations did not. Because gold is most sensitive to real yields, that is the variable to watch when interpreting gold price moves.
Why Do Real Yields Move Gold More Than the Fed Funds Rate?
Gold does not pay interest, dividends, or coupons. Its only cost is the opportunity cost of holding an asset that yields nothing while alternative investments earn interest. That opportunity cost is determined by the real yield—the inflation-adjusted return on safe, interest-bearing assets—not the nominal Treasury yield by itself.
When real yields rise, the cost of holding gold increases and gold usually weakens. When real yields fall or turn negative, the relative appeal of gold rises sharply because bonds would then deliver negative purchasing-power returns. This mechanism consistently explains gold’s direction better than short-term policy rates like the Fed funds rate, which influence gold only indirectly by affecting longer-term real yields.
The recent data illustrates this clearly. The largest single-day jump in the real 10-year yield occurred between September 22 and 23, 2026, when the TIPS yield climbed sharply. That same session produced one of gold’s biggest one-day declines in recent weeks. While a single day does not prove causation, the alignment is consistent with how real yields influence gold and is easy to verify in future moves.
The Knowledge That Changes Everything

Two essential guides — yours free. Understand why gold matters and why fiat currencies have historically failed.
Are Real Yields Currently Positive or Negative?
As of September 23, 2026, real yields are solidly positive at roughly 2.76%. That contrasts with the negative-real-yield environment of 2020–2022, when “safe” bonds effectively guaranteed a loss in purchasing power and made gold a more obvious hedge. Today’s positive and rising real yields represent a genuine headwind for gold, though gold’s resilience amid that headwind is noteworthy.
The analytical framework is straightforward: decomposing nominal yields into their real component and breakeven inflation tells you whether a move is driven by changing inflation expectations or by a change in the true, inflation-adjusted cost of money. That decomposition clarifies the forces at work in any regime.
Why Do Many Reports Blame Inflation Instead of Real Yields?
Online commentary often attributes gold moves to inflation expectations and dollar strength or weakness because those narratives are simpler and more familiar. Social sentiment around gold has emphasized “CPI-driven” stories even when breakeven inflation was stable and real yields were the variable that actually moved. The two 10-year yields can look similar at a glance, which makes misinterpretation easy. Checking the real yield directly prevents that error.
How You Can Check Real Yields Yourself
You don’t need expensive data terminals. The Federal Reserve Bank of St. Louis provides public, daily data for the relevant series. Look up the nominal 10-year yield (the standard Treasury rate), the real 10-year TIPS yield, and the 10-year breakeven inflation rate. Pull two to three weeks of daily values and compare them.
A simple rule of thumb: if the real yield and the nominal yield move together while breakeven inflation is flat, the story is a real-rate move. That typically weighs on gold when yields rise and supports gold when yields fall. If breakeven inflation is the one moving while the TIPS yield is steady, then changing inflation expectations are driving the move and the effect on gold is less consistent.
Stay On Top of Gold & Silver Prices
Get important market alerts sent straight to your inbox.
People Also Asked
What is the difference between a real yield and a nominal yield?
A nominal yield is the stated interest rate on a bond and includes an inflation premium. A real yield removes that inflation premium and shows the inflation-adjusted return. For the 10-year US Treasury, the nominal rate and the TIPS yield differ by the market’s breakeven inflation rate, which reflects expected average inflation over the next decade.
Should investors watch real yields or nominal yields when following gold?
Investors tracking gold should focus on real yields. Nominal yields mix inflation expectations and the true cost of lending; only the inflation-adjusted component consistently explains gold’s directional moves. During the September 2026 window discussed here, real yields moved in step with nominal yields while breakevens were flat—evidence that real rates were the driving factor.
How do I check real yields myself, step by step?
Use the public data service from the Federal Reserve Bank of St. Louis to retrieve three series: the nominal 10-year Treasury rate, the 10-year TIPS (real) yield, and the 10-year breakeven inflation rate. Pull recent daily data and compare their movements. If the TIPS and nominal yields move together while breakeven inflation is stable, the move is a real-rate event.
What happens to gold if real yields keep rising?
Rising real yields increase the opportunity cost of holding a zero-yield asset like gold, which is typically a headwind. Historically, a modest move in real yields has correlated with noticeable moves in gold prices, but the relationship is directional rather than deterministic. Other factors such as central bank purchases, currency moves, or geopolitical demand can offset or amplify the effect.
What if breakeven inflation starts rising instead of real yields?
If breakeven inflation rises while real yields remain steady, the story becomes one of rising inflation expectations. That scenario tends to support gold, though its effect is typically less immediate and less consistent than changes in real yields. Monitoring the three-series decomposition will make such a shift visible early.
Why does gold react to real yields rather than the Fed funds rate?
The Fed funds rate is a short-term policy instrument. It affects gold only indirectly through its influence on longer-term, inflation-adjusted yields. The market’s real 10-year yield is the operative variable that sets the opportunity cost of holding gold and therefore tends to move the metal more directly than short-term policy rates.
Sources
Federal Reserve Bank of St. Louis public data for the 10-year nominal Treasury rate, the 10-year TIPS yield, and the 10-year breakeven inflation rate; historical gold and silver price series; market commentary and public Fed remarks from the September 2026 window.
Disclaimer: This article is informational only and does not constitute investment advice. Past performance is not indicative of future results. Consult a qualified financial advisor before making investment decisions.
You May Also Like:
- How to Read a Gold Spot Price Chart: The Four Things That Actually Matter
- Central Banks Hold Large Gold Reserves; Sovereign Wealth Funds Vary in Allocation
- You Don’t Need to Take Physical Delivery to Sell Gold — What Actually Happens
- The Real Price Considerations for Small Gold Bars
- What Are Negative Real Interest Rates, and Why Does Gold Thrive in That Environment?
- Measured Costs: Comparing Live Prices to Find the Cheapest Way to Buy Gold
- How Much Silver Should You Own? A Practical Allocation Guide
- Who Owns U.S. Debt? A Look at Major Holders and Trends