
Silver is trading around $69.20 an ounce today, hovering near its highest levels since May. Yet the most revealing story this week is not the spot price itself but what’s unfolding inside COMEX’s delivery system as September’s silver contract approaches First Notice Day in a matter of days.

The Edge Every Investor Needs
Smarter precious metals investing starts here. The Nuggets Newsletter brings essential market insights, Fed updates, global trends, educational videos, and much more.
What Is First Notice Day, and Why Does It Matter for Silver?
First Notice Day is the deadline when holders of futures contracts must choose to close their position, roll it into a later month, or stand for physical delivery. Each COMEX silver contract represents a legal claim on 5,000 troy ounces of silver. The vast majority of traders use contracts solely for price exposure; they do not intend to take delivery of metal. Still, a subset of participants will elect delivery, and when that happens a paper contract converts into a real demand for bullion.
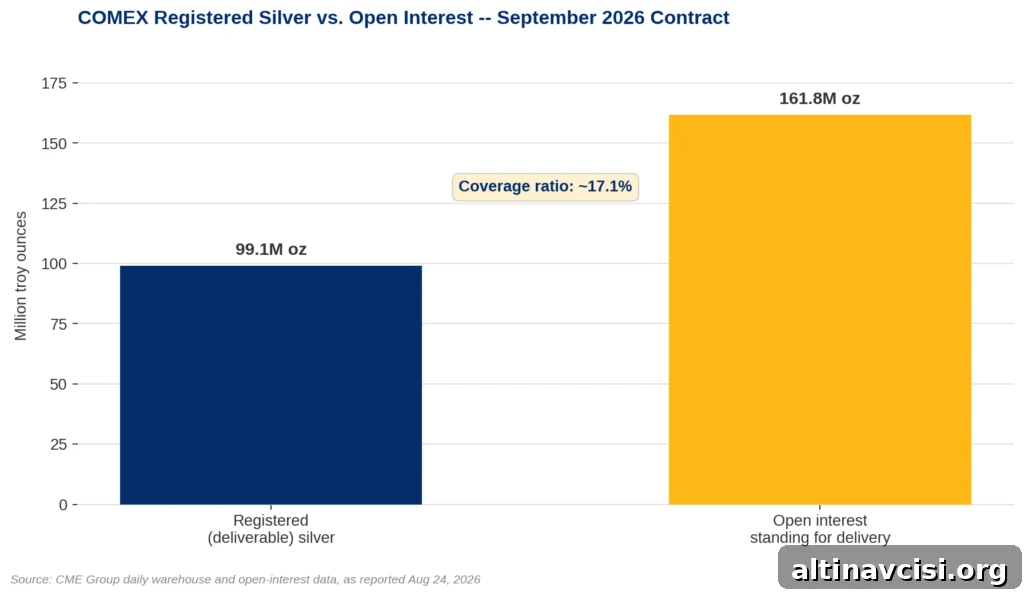
According to the latest reporting window from CME Group, the September 2026 silver contract still shows 32,363 open contracts. That equates to roughly 161.8 million ounces standing against a COMEX-registered deliverable stock of approximately 99.1 million ounces. That disparity between paper claims and immediately deliverable metal is the central dynamic this week.
How Much Deliverable Silver Does COMEX Actually Have?
COMEX warehouse stocks are categorized as either registered or eligible. Registered silver carries an active warehouse warrant, meaning it is available for immediate delivery against contracts. Eligible silver meets the same physical standards and sits in the same vaults but has not been moved into the registered pool by its owner.
In the most recent warehouse report, registered inventories were near 99.1 million ounces while an additional roughly 238.7 million ounces were listed as eligible but not warranted. Analysts typically compare open interest to registered stock to produce a coverage ratio. That ratio currently sits near 17.1%, a level that is tight relative to many historical readings though not unprecedented. For context, April’s First Notice Day saw the ratio closer to 13–14%, so the ratio has loosened somewhat since spring even as nominal open interest has declined sharply.
Open interest dropping from 81,726 contracts on July 24 to about 32,363 today is a familiar pattern heading into delivery months. Most speculative positions are rolled or closed before delivery approaches because those holders do not want the underlying metal. Therefore, the absolute open-interest number is less informative by itself than the relationship that number represents to registered inventory.
Why Does the Coverage Ratio Matter If Most Contracts Never Stand for Delivery?
The coverage ratio is not a forecast; it is a snapshot of the exchange’s capacity to meet delivery claims immediately. A futures contract is a legal claim on metal, whereas registered inventory is the pool of bars the exchange can hand over. When paper claims significantly exceed registered metal, the ratio quantifies that structural gap.
Mechanics within delivery months can mute apparent inventory drawdowns. For example, a depository receipt representing specific vaulted bars can change hands multiple times during delivery without reducing the registered total: one holder can request delivery, receive a receipt, and then redeliver the same bars, leaving the registered count unchanged. That process means gross delivery activity can overstate the true reduction in available metal.
Nonetheless, the headline ratio — today roughly 17.1% — highlights a persistent divergence between the size of the paper market and the ounces immediately available for settlement. For market participants and savers, that divergence underscores the difference between owning a price exposure instrument and owning physical metal you can control directly.
What Does This Mean for Someone Deciding Between Paper and Physical Silver?
An ETF share or a futures contract provides price exposure but does not automatically confer direct ownership of vaulted metal in your name. Only those who stand for delivery and successfully take possession hold physical silver. The coverage ratio illustrates, in real time, how much of the paper market could convert to metal at once without drawing on eligible inventories that are not yet warranted.
For savers and individual investors, that structural gap is central to the decision-making process. If immediate, indisputable control of bullion matters, physical ownership and secure possession are the only ways to guarantee it. If price exposure and liquidity are the priority, paper instruments can be efficient, but they come with counterparty and delivery considerations reflected in the coverage ratio.
What Should Investors Watch Next?
First Notice Day for the September contract is imminent. Market participants should watch whether remaining contracts continue to roll out at recent rates and whether registered inventory moves meaningfully. Monitor whether the coverage ratio holds near 17.1% or tightens further as delivery approaches. Each delivery-month reading — including December’s upcoming First Notice Day — adds incremental data to a pattern that has been evident throughout the year.
Separately, both gold and silver remain near multi-month highs ahead of major central-bank events that can influence short-term sentiment. Those macro catalysts are distinct from COMEX delivery mechanics but can interact with them: price moves can change incentives for who stands for delivery and who rolls positions. For investors, paying attention to both the plumbing of delivery mechanics and the broader macro picture provides a clearer assessment of risk and liquidity in the precious-metals complex.
SOURCES
1. CME Group — Precious Metals Outlook 2026: Market Dynamics Following a Record-Breaking Year (CME Group publication)
2. CME Group — Historical Registrar Reports, Warehouse & Depository Stocks (Silver Stocks), accessed August 27, 2026
3. CME Group — Daily Information Bulletin, Metals Futures Products (Section 62), July 24, 2026
4. COMEX September 2026 silver contract open interest and registered/eligible warehouse figures, as reported by independent market-data aggregators reading CME Group’s daily and weekly published data (Aug 24, 2026 reporting window)
5. Commentary on depository receipt redelivery mechanics within a single COMEX delivery month, as reported in industry coverage (June 12, 2026)
Disclaimer: This article is for informational purposes only and does not constitute investment advice. Past performance is not indicative of future results. Always consult a qualified financial advisor before making investment decisions.
You May Also Like:
- Five Gold Signals Fired This Week. None of Them Are About Today’s Price.
- Gold Fell 9% the Last Time Warsh Spoke. He’s Back Tomorrow.
- Gold Ran Past Wall Street’s Own Price Targets. Four Banks Disagree on What Happens Next.
- Silver Beat Gold in August. Almost Nobody Said So.
- Americans Spent More in July. They Got Nothing Extra for It.
- The Fed Has Two Hike Numbers Right Now. Almost Everyone Quotes the Wrong One.
- Gold and Silver Pulled Back Today. The Treasury’s Plumbing Explains Why.