Key Takeaways
- Gold is trading near $4,380 today, up roughly 10% from its early-August low near $4,000 — the largest monthly gain since January’s record run.
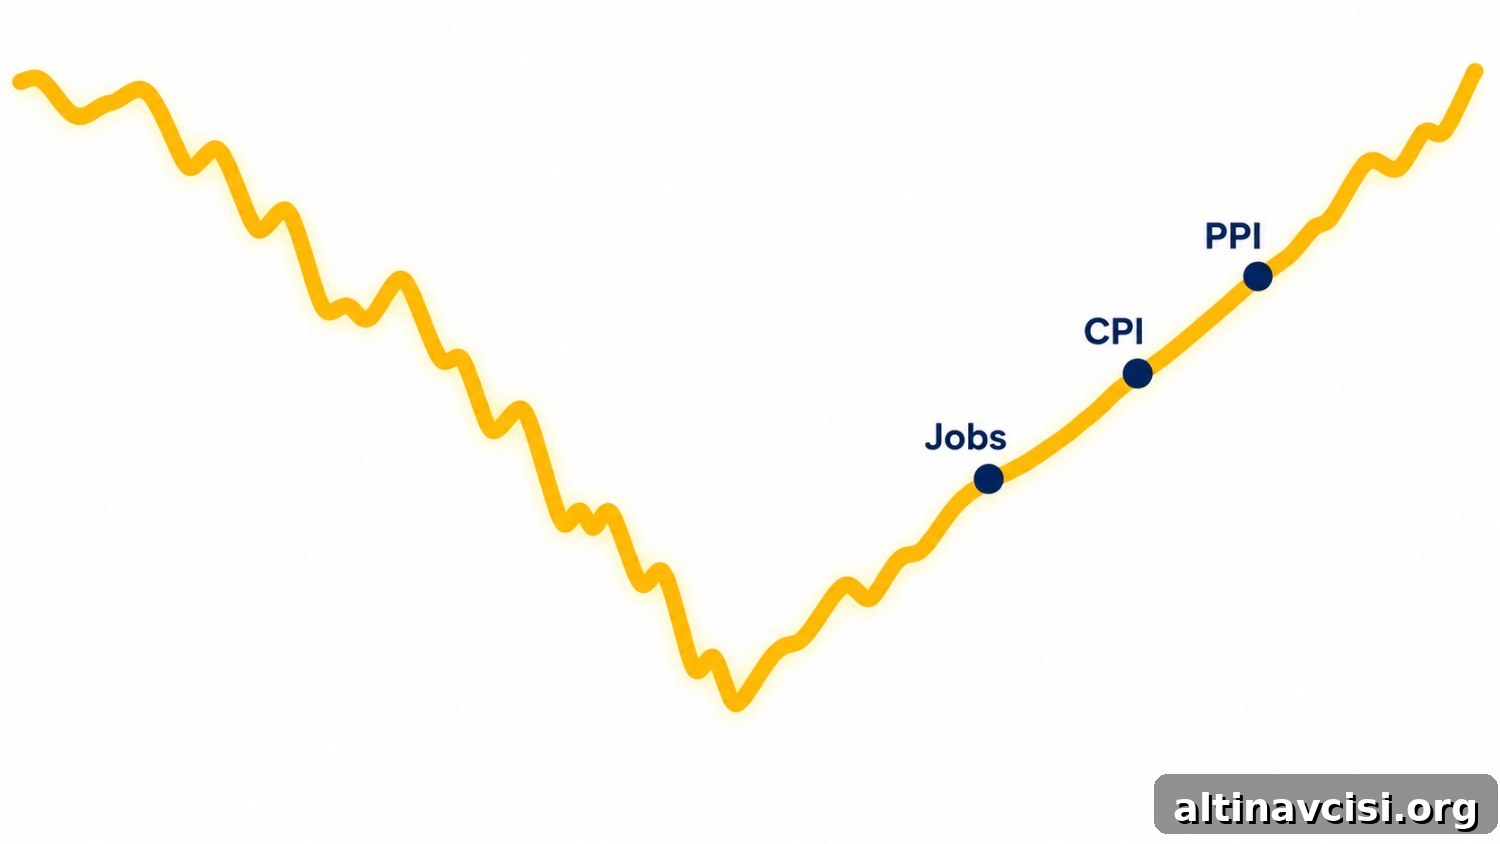
- Three data prints in one week flipped the September rate-hike calculus: July jobs fell 23,000 against consensus, July CPI decelerated to 3.4% year-over-year, and July PPI was flat. September hike probability fell from roughly 50% to approximately 31%.
- Central banks bought 288.9 tonnes of gold in Q2 2026 — a quarterly record, up 62% year-over-year — while gold was falling. That structural buying at declining prices provides the floor this rally is building from.
- The next decisive events: August CPI on September 10 and the Federal Open Market Committee meeting on September 15–16. Those two releases will determine whether the August rally extends or reverses.
- Major institutions have revised their year-end targets down from January highs, but Goldman Sachs ($4,900), JPMorgan ($4,500 Q4), and Bank of America ($4,360) remain above current prices.
Gold entered August near $4,000. As of mid-August it was trading near $4,380 — on course for its strongest monthly gain since January’s record run.
This is the third installment in a monthly Gold Price Outlook series. Prior installments examined why gold corrected nearly 25% from its all-time high and why the structural case remained intact. August is different: a single week delivered three economic releases that shifted the Federal Reserve’s calculus, compressed rate-hike expectations, and drove gold to a ten-week high. Below we explain what happened and what it means for precious metal holders.
Why Did the Gold Price Rise in August 2026?
The change has a single root cause and three branches.
The Root Cause: Real Yields
The primary driver is real yields. Gold pays no interest, so its attractiveness is inversely related to the real yield on interest-bearing assets. When investors expect the Fed to raise rates, real yields rise and bonds and money-market instruments look more appealing relative to gold. When rate-hike expectations compress, that competitive pressure eases. Roughly 90% of annual gold demand is for store-of-value, reserves, and jewelry, which makes gold highly sensitive to shifts in real-rate expectations.
Three consecutive economic releases meaningfully compressed those expectations in early August.
The Three Prints That Moved the Market
Branch one: the jobs report. On August 7 the U.S. employment report showed a 23,000 decline in nonfarm payrolls for July versus a consensus expecting a gain. Revisions to prior months lowered recent job creation and pushed the trailing 12-month average down to a pace consistent with weak labor-market momentum. A less robust labor market reduces the Fed’s case for raising rates, and markets quickly repriced September odds lower.
Branch two: July CPI. On August 12 the consumer price index rose only 0.1% month-over-month, with a 3.4% annual rate — a second consecutive monthly deceleration. Core CPI rose modestly. Slower inflation suggested the recent energy-driven acceleration was fading, reinforcing the idea that the Fed could pause rather than tighten further.
How PPI Sealed the Case
Branch three: July PPI. On August 13 wholesale prices were flat month-over-month, with an annual rate of 4.7%. Core PPI excluding food and energy rose less than consensus. That softer wholesale-inflation reading, combined with the prior two prints, shifted market expectations for a September hike. Together these releases moved September rate-hike odds from roughly 50% to approximately 31%, and gold responded by advancing from around $4,000 to an intraday high above $4,500 before settling near $4,380.
The Knowledge That Changes Everything
Two essential guides — yours free. Understand why gold matters and why fiat currencies always fail.
Are Central Banks Still Buying Gold in 2026?
Yes. Their second-quarter behavior is one of the most important structural datapoints in this article.
The World Gold Council reported that central banks purchased a net 288.9 tonnes of gold in Q2 2026, a 62% increase from Q2 2025 and the strongest second-quarter total on record. This buying occurred while gold prices were falling, indicating reserve managers used lower prices to accumulate rather than exit.
Poland led purchases with 51 tonnes in Q2, moving toward an internal target of 700 tonnes. The People’s Bank of China added 33 tonnes, continuing a long-run accumulation that spanned multiple quarters. Uzbekistan, Kazakhstan, Jordan, and the Czech Republic also added material amounts. On the sell side, Russia trimmed holdings and Turkey slowed its unwinding. Net central-bank demand in Q2 formed a structural floor beneath the market just as retail investors were exiting ETF positions.
Total H1 2026 central bank purchases reached 345 tonnes. Gold-backed ETFs logged net outflows in Q2, primarily in North America, but inflows resumed in August. The asymmetry — sovereign accumulation at lower prices while retail sold — is a key structural support for the recent rally.
What Does the September FOMC Meeting Mean for Gold?
The Federal Reserve’s September 15–16 meeting is the most consequential near-term event for gold.
If the Fed holds rates at 3.50–3.75% — the outcome assigned the larger probability in markets — real-yield pressure would ease and the primary headwind for gold would diminish. That would leave a runway toward institutional targets in the $4,500–$4,900 area.
If the Fed raises rates by 25 basis points to 3.75–4.00% — a less likely but possible outcome — higher real yields would limit gold’s upside. The Fed’s updated projections and the dot plot included with this meeting will shape markets as well.
What Decides the Outcome: August CPI on September 10
The decisive data point is August CPI, released five days before the FOMC meeting. A print above recent levels would revive the hike case; a print at or below the recent 3.4% reading would further cement a pause. Markets will focus intensely on that single release as the primary variable determining September policy.
What Is the Gold Price Forecast for the Rest of 2026?
Institutional forecasters trimmed their projections from January but mostly remain above current prices. Goldman Sachs lowered its year-end target to $4,900; JPMorgan anticipates a Q4 average near $4,500; Bank of America projects a 2026 average around $4,360. The World Gold Council’s mid-year fair-value range centers near $4,100 with an upper band near $4,305. These forecasts reflect a view that gold’s long-term drivers remain intact despite a shorter-term repricing of rate expectations.
Three Structural Pillars Supporting Gold into Year-End
Three structural themes support gold’s outlook through year-end:
First, the interest-rate ceiling. Rising federal interest costs make sustained aggressive rate hikes more costly for the government, which acts as a natural constraint on how far tightening can progress.
Second, central-bank demand. Record quarterly purchases by reserve managers during a price decline highlight a durable source of demand that does not react to short-term price swings the way retail ETF flows do.
Third, the correction precedent. Historical bull markets in gold have included steep corrections that preceded renewed advances. Mine supply growth has been modest relative to monetary expansion, supporting a longer-term supply-demand backdrop favorable to gold.
What Should Gold Holders Watch in the Weeks Ahead?
Key near-term items: August CPI on September 10 and the FOMC meeting on September 15–16. Between now and then, central-bank commentary at scheduled events will be parsed for tone and intent. Physical holders should focus on the structural case rather than short-term volatility: gold remains a monetary asset that performs when real returns on cash and bonds decline and when sovereign demand is strong.
If you hold physical gold with institutional-grade custody, the recent data likely reinforces your allocation thesis. New buyers should weigh current prices relative to long-term fair-value ranges and to the risk that short-term rate moves can produce volatility.
Stay On Top of Gold & Silver Prices
Get important market alerts sent straight to your inbox.
People Also Ask
What is the gold price outlook for August 2026?
Gold entered August near $4,000 and rose roughly 10% month-to-date to about $4,380 after three consecutive economic releases shifted September rate-hike expectations lower. The intraday high in mid-August reached above $4,500 before settling back into the $4,300–$4,400 range.
Why is the gold price rising in August 2026?
Three economic prints compressed Fed rate-hike expectations: a weak July payrolls report, slowing CPI, and flat PPI. Because gold yields no interest, it benefits when expected real yields decline. Lower hike odds translate into lower expected real yields and higher gold prices.
What does the September FOMC meeting mean for gold?
The September 15–16 meeting will be guided heavily by the August CPI print five days earlier. A hold would support the rally and clear the path toward institutional price targets; a hike would pressure gold by raising real-yield expectations.
Are central banks still buying gold in 2026?
Yes. Q2 2026 saw record second-quarter central-bank purchases during a period of price weakness. Sovereign accumulation at lower prices provides a durable demand floor under the market.
What is the gold price forecast for year-end 2026?
Institutions have lowered targets from January but remain constructive: Goldman Sachs at $4,900 year-end, JPMorgan at $4,500 for Q4, and Bank of America averaging around $4,360 for 2026. The World Gold Council’s fair-value midpoint sits near $4,100 with an upside band toward $4,305.
SOURCES
Bureau of Labor Statistics — Employment, CPI, and PPI summaries; World Gold Council — Gold Demand Trends Q2 2026 and Gold Mid-Year Outlook 2026; CME Group — FedWatch Tool; Federal Reserve Board — FOMC Statements; Congressional Budget Office — Budget and Economic Outlook; GoldSilver — live spot prices.
Disclaimer: This article is for informational purposes only and does not constitute investment advice. Past performance is not indicative of future results. Always consult a qualified financial advisor before making investment decisions.
You May Also Like:
- 14 Million Coins Sold. Zero Design Changes in 35 Years. Here’s Why Investors Keep Choosing the Philharmonic.
- Two Inflation Numbers Come Out Every Month. The Fed Only Cares About One.
- Why Your Commodity ETF Gives You Almost No Gold — and What That Costs You
- American Gold Buffalo Coin: The Complete Guide to the U.S. Mint’s Purest Gold
- The Fed Printed $7 Trillion. Velocity Kept It Quiet. That’s Changing.
- Most 401(k)-to-Gold-IRA Rollovers Lose 20% Immediately. Here Is Why — and How to Avoid It.
- Gold Just Climbed to a 7-Week High. One Number Changed Everything.