
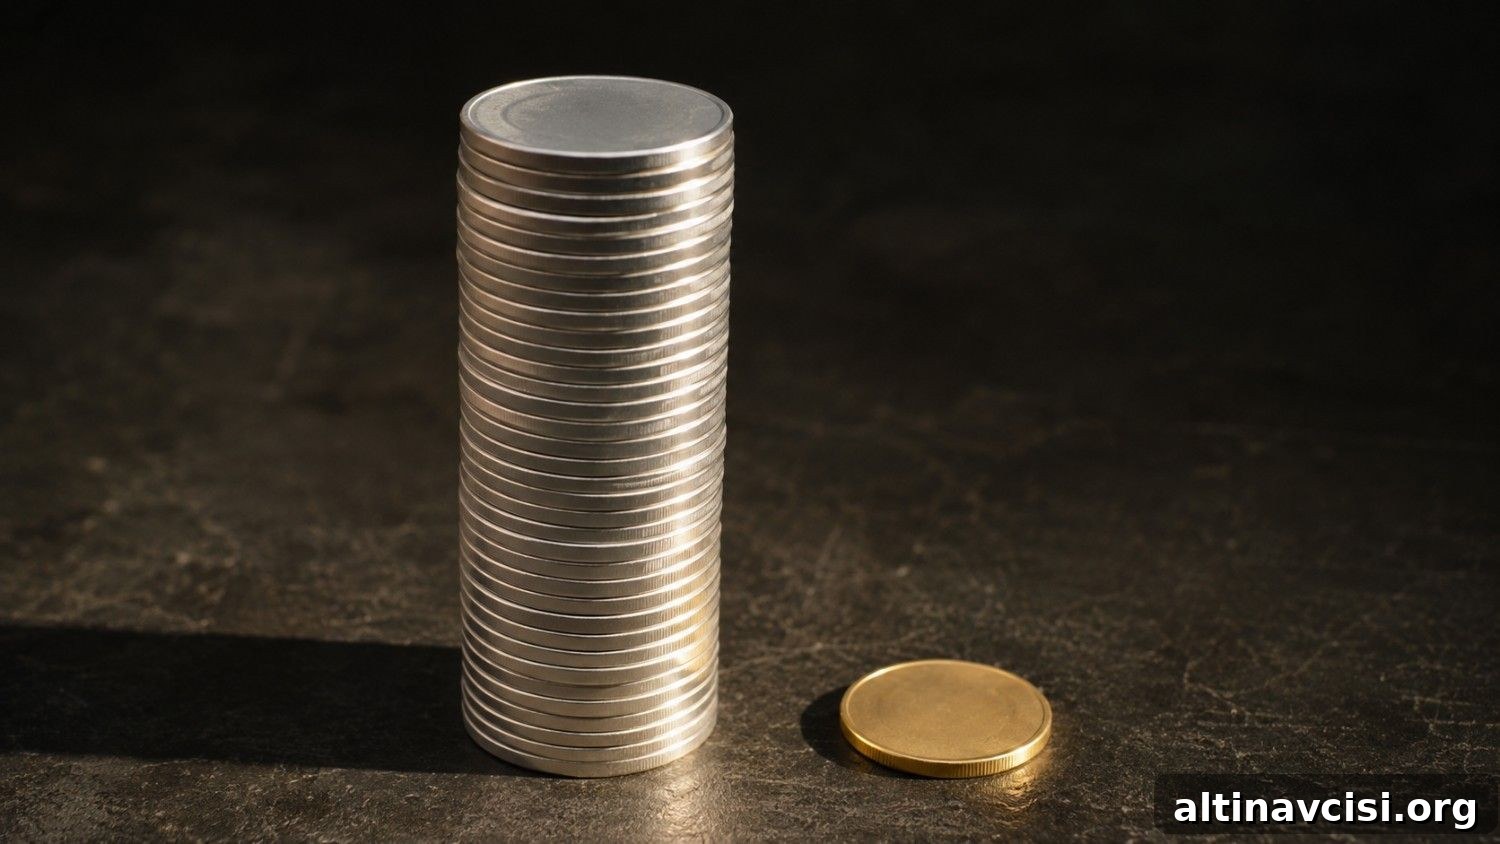
Yesterday, silver outperformed gold and the gold-silver ratio compressed to 66.5. Today that move reversed: silver fell about 2.3%, gold was essentially flat, and the ratio widened back to 67.5. Five developments explain the session, and the common thread is that tomorrow’s July Consumer Price Index (CPI) report will likely determine whether any of them persist.
Why Did the Gold-Silver Ratio Widen to 67.5 Today?
Silver opened above $66 — its highest level since June — then reversed sharply. By early afternoon it had given up roughly 2.3%, pushing the gold-silver ratio from yesterday’s 66.5 to 67.5 in a single session. Gold reached an intraday high near $4,435 before settling back and finishing essentially flat.
The direction of the ratio is the key signal. A ratio at 67.5 sits above the roughly 50-year historical average near 65, implying silver is cheap relative to gold on a long-term basis. When silver underperforms gold ahead of an inflation print, markets are often pricing in a Federal Reserve rate hike. Higher real yields tend to weigh more heavily on silver than on gold because silver has significant industrial demand while gold functions primarily as a monetary and safe-haven asset. In a rate-hike scenario, the industrial component of silver is vulnerable while gold holds up better.
Tomorrow’s CPI is the binary event: a soft print would likely narrow the ratio, while a hotter-than-expected print would probably extend it.

The Edge Every Investor Needs
Smarter precious metals investing starts here. The Nuggets Newsletter delivers essential market insights, central bank updates, global trends, educational perspectives, and timely commentary.
What Does the Barrick-Newmont $1.95 Billion Settlement Mean for Gold Investors?
Barrick Mining agreed to a $1.95 billion cash settlement with Newmont related to the Fourmile deposit and the Nevada Gold Mines joint venture. Newmont consented to Barrick’s planned North American IPO, which Barrick aims to complete by year-end 2026. Barrick reported Q2 net earnings of $1.22 billion (about $0.73 per share), a 55% year-on-year increase. However, higher fuel costs and a retroactive tax penalty in Mali reduced the adjusted earnings per share to $0.82, slightly below the consensus of $0.83.
The market reaction was negative: Barrick shares fell as much as 9% on the Toronto Stock Exchange. One interpretation of the settlement places a relatively high implied valuation on the Fourmile asset, a structure some observers judged to favor Newmont. The episode underscores a broader point: mining companies typically trade at a discount to physical gold because they carry operational, geopolitical, and execution risk that bullion does not. Physical gold ownership removes those layers of company-specific risk.
Are More People Buying Physical Silver Even as the Price Falls?
Perth Mint data for June 2026 show silver product sales of 293,732 ounces, the lowest monthly figure for the year; July data were not available at the time of writing. The pattern matters: buyers stepped in as spot silver moved well below January’s record highs, preferring physical metal over momentum trading strategies.
The Silver Institute projects another annual supply deficit for 2026, with a substantial shortfall measured in tens of millions of ounces. Since 2021 the cumulative draw on above-ground silver stocks has been large, and new mine projects take many years to come online, so mine supply cannot close the gap quickly. That structural deficit helps explain why physical demand can rise even as the paper price declines: market participants who have been waiting to accumulate often buy into price weakness, reinforcing long-term scarcity dynamics.
Is China Still Buying Gold — and by How Much?
China’s central bank continued to add to its gold reserves in July, recording one of the larger single-month purchases in recent months and extending a multi-month buying streak. Total official reserves reached a fresh high. The pattern of purchases suggests the central bank is accumulating allocation to diversify reserves rather than chasing short-term momentum.
Domestic demand in China has also been notable: Chinese gold ETFs recorded a string of inflows, attracting institutional capital as local equity market volatility encouraged allocations to alternative stores of value. Despite the accumulation, gold still represents a minority share of China’s overall reserve mix, leaving room for more purchases if policy or strategy dictates.
What Could Tomorrow’s CPI Report Do to Gold and Silver Prices?
July CPI data are scheduled to print Wednesday at 8:30 a.m. ET. Market-implied probabilities for a September rate decision were near even at the time of this report, giving the CPI release substantial power to move yields and precious metals in either direction.
If the CPI is softer than expected — for example, if energy components cool despite oil trading near current levels — the Fed’s tightening case would ease, Treasury yields could drop, and gold might reclaim momentum toward higher levels. In that scenario silver typically outperforms gold on the upside because its price often benefits more from lower real yields and renewed industrial optimism, narrowing the gold-silver ratio.
Conversely, a hotter CPI would strengthen the case for additional rate hikes, pushing yields higher and pressuring both metals. Silver would likely lag gold in that environment because its greater exposure to industrial demand makes it more sensitive to rising real rates, which would widen the ratio further. The 10-year Treasury yield had already moved higher during the session, a factor that contributed to gold surrendering its intraday high.
Stay On Top of Gold & Silver Prices
Get important market alerts sent straight to your inbox.
SOURCES
1. Bloomberg — reporting on regional tensions and energy market developments.
2. Mining Weekly — coverage of the Barrick-Newmont agreement and IPO implications.
3. Mining.com — corporate developments at major miners.
4. Barrick Mining press releases — quarterly results and company disclosures.
5. Perth Mint — monthly sales updates for precious metal products.
6. Bloomberg — central bank reserve purchases reporting.
7. Reuters / Kitco — market commentary around inflation and gold.
8. Silver Institute — World Silver Survey 2026.
9. World Gold Council — central bank gold reserve data.
10. Industry price feeds — live gold and silver spot prices.
11. CME Group — Fed rate probability tools and market-implied odds.
Disclaimer: This article is for informational purposes only and does not constitute investment advice. Past performance is not indicative of future results. Always consult a qualified financial advisor before making investment decisions.
You May Also Like:
- Gold Slipped at the Open. China Bought the Dip. Again.
- Why Is Silver Outperforming Gold Today? The Dual-Engine Mechanism Explained.
- Regional tensions around energy routes and their implications for gold.
- Gold Opened at Its Highest Level Since June. Five Things Are Keeping It From Going Higher.
- Gold Had Its Best Week Since January. Wednesday’s CPI Could Take It Back.
- Gold Just Climbed to a 7-Week High. One Number Changed Everything.