Key Takeaways
- Robert Kiyosaki posted a $35,000 gold target on March 16, 2026 — a forecast that requires a systemic financial collapse as the trigger. That scenario is low probability and should not drive most near-term allocation decisions.
- Major Wall Street institutions set year-end 2026 gold targets between approximately $4,500 (JPMorgan) and $4,900 (Goldman Sachs). These forecasts assume consolidation rather than systemic collapse.
- Gold trades near $4,063 today — roughly 27% below its January 29, 2026 intraday high — representing a structural discount relative to many institutional forecasts.
- Silver is in its sixth consecutive year of structural supply deficit, with the World Silver Survey 2026 forecasting a 46.3 million ounce shortfall in 2026.
- Dollar-cost averaging removes the need to pick a bottom and systematically lowers your average cost over time — a sensible approach when forecasts diverge widely.
- Central banks bought 863.3 tonnes of gold in 2025, well above the 2010–2021 annual average of 473 tonnes, according to public gold demand data.
Robert Kiyosaki has a long record of public predictions about markets and money. Some of his calls have been directionally accurate, sometimes far earlier than most observers expected. Others did not materialize on any reasonable timetable. In 2025 he predicted silver would reach $70 within a year; silver later rose well past that level and reached an intraday peak in January 2026. He has also issued crash warnings that did not coincide with immediate market collapses.
Keep that mixed track record in mind when evaluating his most recent, high-profile targets. On March 16, 2026, Kiyosaki posted that gold could reach $35,000 per ounce following what he described as a historic bubble bust. In May 2026 he added a $200 silver target. Those figures attract heavy online attention, but they should not be the sole basis for your asset allocation decisions.
A more practical framing is simple: gold is trading near $4,063 per ounce today, about 27% below its January 29, 2026 intraday record. That gap is what individual investors should evaluate: is today a buying opportunity, or is the market signaling a deeper correction? The answer depends on your goals, time horizon, and willingness to accept volatility.
What Is Robert Kiyosaki’s Gold Prediction, and Why Does It Capture So Much Attention?
Kiyosaki is best known for Rich Dad Poor Dad, a bestselling personal finance book that built him a large audience. His core monetary thesis is consistent: fiat currencies are vulnerable to debasement through government borrowing and central bank money creation, and tangible assets — gold, silver, real estate, and sometimes Bitcoin — are safer stores of purchasing power over the long run.
That framework is shared by many institutional buyers, particularly central banks and sovereign wealth funds, which explains why his commentary finds an eager audience. Where he departs from mainstream institutional forecasts is on timing and magnitude. A $35,000 per ounce gold price implies a collapse of confidence in the dollar and an extreme reshaping of global monetary arrangements — a scenario institutions broadly regard as possible but not their base case.
The mechanism Kiyosaki highlights — fiscal stress, rising interest costs, and potential loss of confidence in fiat money — is grounded in observable data. The U.S. national debt is large, and interest expense has become a notable portion of federal spending. Those trends increase vulnerability over the long term. But translating that vulnerability into an immediate, enormous revaluation of gold requires a low-probability shock, which is why institutional forecasts remain far lower than Kiyosaki’s headline figure.
The Knowledge That Changes Everything

Two essential guides — free. Understand why gold matters and why fiat currencies face long-term erosion.
How Do Kiyosaki’s Forecasts Compare to Institutional Gold Price Predictions?
The difference between Kiyosaki’s targets and institutional forecasts reflects different assumptions. Institutional models typically use real interest rates, currency dynamics, central bank flows, and ETF demand to project prices. Recent year-end 2026 forecasts from major banks cluster roughly between $4,500 and $4,900 per ounce, with some upside scenarios slightly higher. These forecasts imply meaningful demand and consolidation, not a systemic collapse.
Kiyosaki’s $35,000 prediction is in a separate category: it envisions a collapse in confidence in the dollar as reserve currency. Institutions consider such an outcome possible but not their central scenario, which is why their quantitative models do not price in that extreme outcome as the base case. Treating that worst-case projection as a primary allocation signal can lead to opportunity costs for investors who need near-term liquidity or income.
Where Kiyosaki aligns with institutional behavior is in the broad structural thesis: central banks and official institutions have been buying gold in meaningful quantities. Recent annual official purchases have been well above historical averages, indicating diversification away from exclusive reliance on any single reserve asset. That trend supports a structural bullish case for gold without requiring an immediate systemic breakdown.
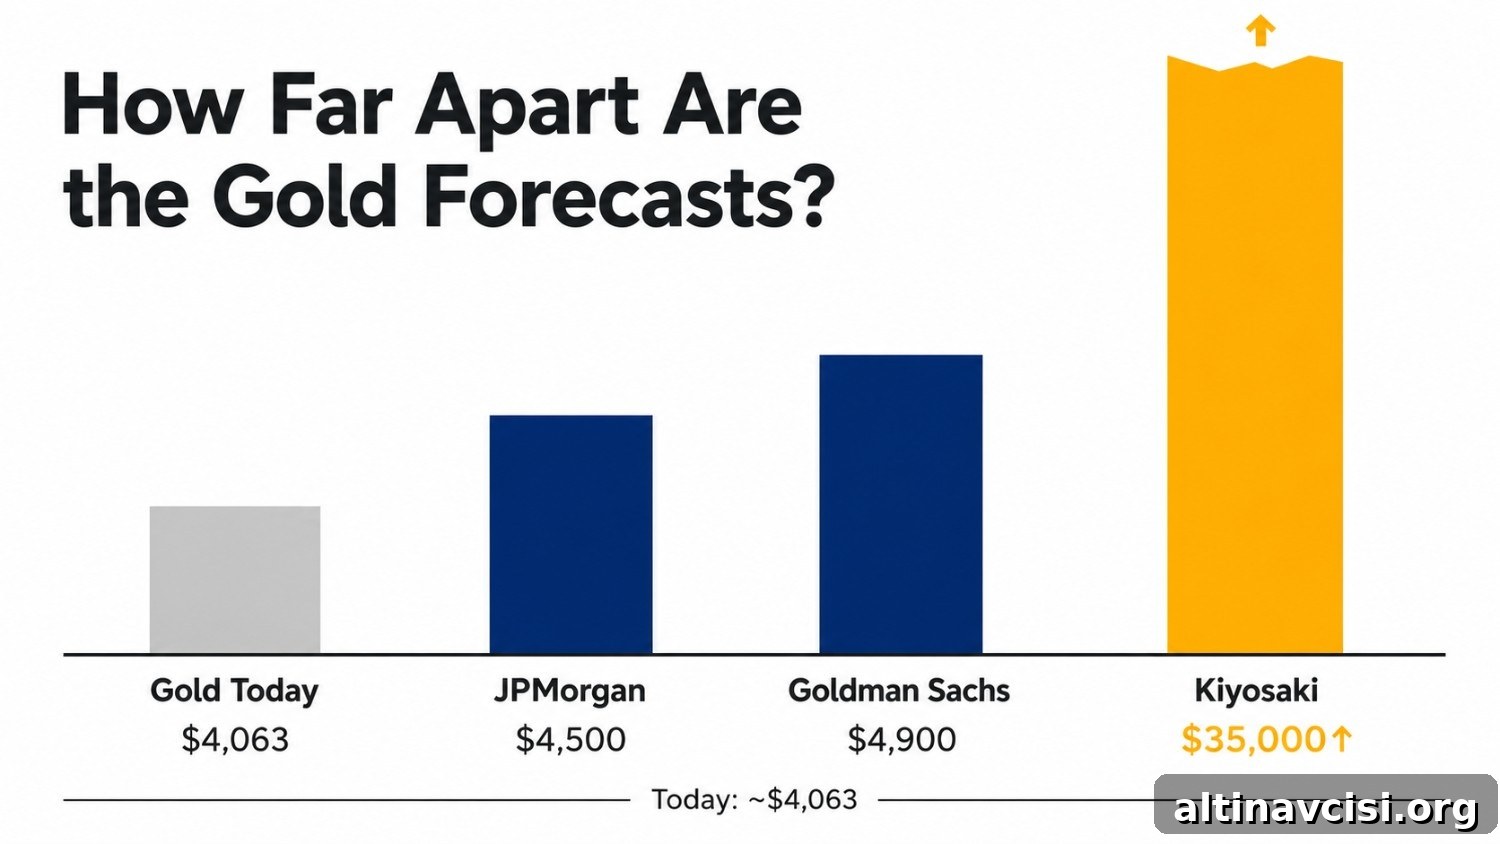
How Far Apart Are the Gold Forecasts?
Kiyosaki’s $35,000 target requires systemic collapse — no major institutional model prices that scenario as the base case.
Institutional year-end 2026 targets
Kiyosaki target (cropped)
Gold today: $4,063. Institutional year-end 2026 targets roughly $4,500–$5,200. Kiyosaki’s $35,000 target is off-chart and would extend several times above typical institutional scenarios.
Sources referenced: institutional research published June–July 2026; public live spot prices as of July 24, 2026; central bank purchase data for 2025.
Why Did Gold Fall So Sharply from Its All-Time High?
Gold reached an intraday peak on January 29, 2026, and then corrected. Today’s trading level near $4,063 represents about a 27% decline from that peak. The correction was driven by specific, observable forces rather than a reversal of the structural case for gold.
A key proximate driver was a spike in energy prices related to geopolitical conflict that increased headline inflation expectations. That shift altered Federal Reserve expectations away from rate cuts and toward rate holds — and in some market pricing, potential hikes. Rising real yields make non-yielding assets like gold relatively less attractive, and gold moved downward accordingly. This cyclical rate sensitivity has overshadowed structural drivers for the moment but does not negate them.
Institutions note that a new category of demand — diversification driven by fiscal concerns and strategic reserve management — has emerged. That demand provides a foundational floor beneath gold prices even when short-term rate dynamics cause volatility.
Is Silver’s Price Correction a Structural Problem or a Buying Opportunity?
Silver closed near $58.55 per ounce on July 24, 2026, down from an intraday high of $121.67 on January 29, 2026. That fall of more than 50% is more extreme than gold’s correction and warrants separate analysis because silver serves dual roles as both an industrial metal and an investment asset.
Approximately 58% of annual silver demand comes from industrial uses — solar, electric vehicles, electronics, and data center infrastructure — while the remainder is split between investment products and jewelry. Industrial demand has remained robust, but investment demand has been more volatile. When investment sentiment retreats, prices can fall even while inventories and industrial demand show tightness.
Industry data indicate the global silver market entered its sixth consecutive year of structural supply deficit in 2026, with a forecast shortfall of tens of millions of ounces. Mine production has been essentially flat for several years, and the deficit has been covered by drawdowns from above-ground stocks. That physical reality suggests long-term upward pressure on prices even if short-term market sentiment is weak.
Kiyosaki’s $200 silver target assumes a macro shock, but the underlying structural supply deficit does not require a shock to be relevant. For investors, that distinction matters: structural scarcity supports a longer-term bullish argument, while short-term timing remains highly uncertain.
How Should an Individual Investor Think About Buying the Dip?
The practical question is whether to buy immediately or wait for lower prices. The honest answer is that no one knows short-term price direction with certainty. Federal Reserve decisions and economic surprises move gold and silver substantially on a 90-day horizon.
Given that unpredictability, a disciplined dollar-cost averaging (DCA) approach is often the most effective way to build exposure. Commit a fixed dollar amount at regular intervals to physical gold or silver purchases. This method reduces the risk of mistiming a single large entry and smooths the average cost over time. For highly volatile assets like precious metals, spreading purchases over six to twelve months converts timing uncertainty into a systematic advantage.
Allocation size depends on your goals. Many wealth-preservation frameworks recommend 5–10% of a diversified portfolio in physical precious metals. That allocation offers meaningful protection against currency debasement without overweighting a non-yielding asset. Investors who assign a higher probability to severe fiscal deterioration might choose larger allocations, recognizing that this is a deliberate strategic overweight rather than a speculative bet.
What Does Kiyosaki Get Right, and Where Should You Apply Skepticism?
Kiyosaki’s most valuable contribution is his emphasis on the difference between paper claims and physical ownership. Physical gold and silver carry no counterparty risk. They do not depend on corporate earnings, bank solvency, or government restraint. Holding metal outside the banking system is a straightforward way to preserve purchasing power through severe institutional stress scenarios.
Where to apply skepticism is his precise timing and extreme price levels. A $35,000 gold price requires systemic failure of the reserve currency; such events occur but are difficult to time and forecast. Building an investment strategy around a low-probability, high-impact forecast can create significant opportunity cost and elevated portfolio concentration risk for many investors.
The structural concerns he highlights — large national debt, rising interest expense, persistent deficits — are real and actionable without accepting his most extreme price targets. Allocating a measured percentage of savings to assets that cannot be inflated away is a reasoned response shared by many institutional and private investors.
Key Considerations Before You Act
Decide what you are solving for. If your goal is to protect purchasing power over a 10–20 year horizon, starting a DCA program at current gold prices offers a logical path. If you seek short-term gains, understand the heightened unpredictability tied to central bank decisions and geopolitical developments.
Practical steps: choose an allocation percentage of your investable assets, set a regular purchase schedule (monthly is a common choice), prefer physical metal if you want to avoid counterparty exposure, and resist reacting to every market swing. Over time, disciplined accumulation can deliver the protective benefits of precious metals without attempting to time peaks and troughs.
Stay On Top of Gold & Silver Prices
Get important market alerts sent straight to your inbox.
People Also Ask
Yes, directionally and repeatedly, though his timing is often imprecise. He has made correct calls about the broad direction of precious metals at times, but using his exact price targets as short-term trading signals is risky because the timing and magnitude are frequently off.
He uses that phrase to describe fiat currency: government-issued money not backed by a physical commodity. His argument is that fiat money tends to lose purchasing power as governments and central banks expand monetary supply, while scarce physical assets retain value.
They serve different purposes. ETFs offer liquidity and convenience but carry some counterparty and custody considerations. Physical gold provides direct ownership and no counterparty risk, which can be important in extreme stress scenarios.
The ratio measures how many ounces of silver it takes to buy one ounce of gold. Historical averages guide relative value decisions: when the ratio is high, silver is historically cheap relative to gold and may outperform when the ratio normalizes.
Private gold holdings among U.S. households are very small as a share of total financial assets. That structural underweight suggests retail demand could grow meaningfully if more households allocate a modest portion of their portfolios to physical metal.
SOURCES
Selected public sources referenced in this analysis include Robert Kiyosaki’s public posts (March–May 2026), U.S. Treasury fiscal data, Congressional Budget Office outlooks, World Gold Council demand data, and the World Silver Survey 2026 from industry research. Live spot prices cited are as of July 24, 2026.
Disclaimer: This article is informational only and does not constitute financial or investment advice. Consult a qualified financial adviser before making investment decisions.
You May Also Like:
- Gold Risk-Reward Calculator: Is Your Portfolio Actually Safe?
- What Are the Best Physical Precious Metals Products to Buy During a Correction?
- Gold Is Down 26%. Silver Is Down 51%. What Does the Stacker Do Now?
- Gold Allocation Calculator: How Much Should Your Portfolio Actually Hold?
- What Is the Gold Volatility Index (GVZ) — and What Does It Mean for You?
- Gold & Silver Market Correction: Is the 2026 Bull Market Over?
- JPMorgan Cut Its Gold Forecast by 25%. Here’s What Long-Term Holders Need to Know.