Key Takeaways
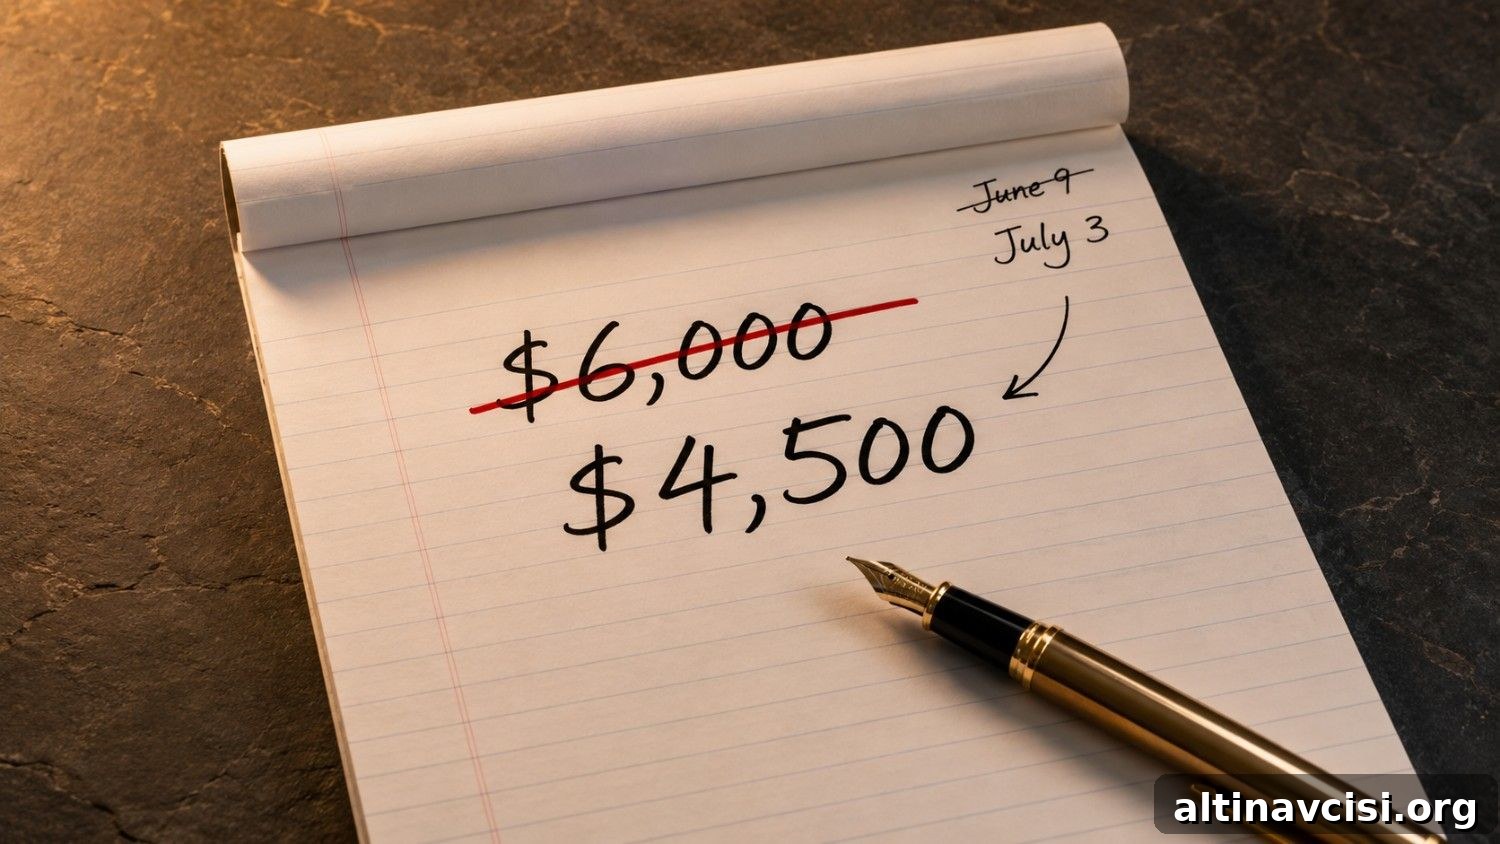
- JPMorgan cut its Q4 2026 gold forecast by 25% to $4,500/oz on July 3, down from a $6,000 target issued June 9. The bank now projects $4,300 as the Q3 average.
- The driver of the cut is a renewed short-term sensitivity to real interest rates: JPMorgan estimates gold has fallen roughly $20/oz for every 1 basis point rise in 10-year real yields since late February.
- A downside path — gold breaking below $4,000 and testing $3,500–$3,600 — would require both hotter-than-expected summer economic data and an earlier-than-expected Fed rate hike. JPMorgan does not view this as its base case.
- JPMorgan’s long-term structural thesis remains intact. The bank expects a renewed upward cycle in 2027 driven by central bank diversification and real-yield normalization.
- Wall Street is divided: Goldman Sachs ($4,900), BofA ($4,800), Deutsche Bank ($4,800), UBS ($5,200 over 12 months) and Morgan Stanley (upside $5,200, base near $4,400) are generally more optimistic than JPMorgan’s Q4 target.
- For silver, JPMorgan projects $60–$65/oz as markets normalize from 2025’s tight supply. Platinum: about $1,800/oz by year-end. Palladium: $1,350/oz by year-end.
On June 9, 2026, JPMorgan told clients it expected gold to reach $6,000 per ounce by year-end. Twenty-four days later the bank reduced that forecast by 25% to $4,500. The change generated polarized headlines: some called the market “broken,” others dismissed the revision as a routine forecast error. Neither reaction helps investors. What matters is the underlying rationale: why the bank changed its view, what would need to happen for the downside scenario to play out, and whether the long-term case for holding physical precious metals has been altered.
Why Did JPMorgan Cut Its Gold Forecast?
JPMorgan’s July 3 note cited two main factors: weaker demand from key buyers and a pronounced re-emergence of gold’s sensitivity to real interest rates. On the demand side, the bank trimmed its 2026 ETF forecast from net inflows of 400 tonnes to net outflows of 50 tonnes, reduced central bank net buying guidance modestly, and lowered expected growth for bar and coin demand. On the rates side, the bank quantified a strong relationship that has reasserted itself: since late February 2026, each 1 basis point rise in the US 10-year real yield has been associated with roughly a $20 decline in gold.
The timing of that shift coincides with the Federal Reserve’s June 17 meeting, the first under Chair Kevin Warsh. The Fed left its policy rate at 3.50%–3.75% but delivered a hawkish surprise: an even split on the dot plot with some members signaling a possible 2026 hike, Warsh withholding his own dot plot, and the removal of forward guidance. Markets read this as hawkish, real yields moved higher, and gold’s renewed negative correlation with real yields became a binding near-term constraint on the metal’s price. JPMorgan’s revision is a direct measurement of that constraint.
The Knowledge That Changes Everything

Two essential guides — yours free. Understand why gold matters and why fiat currencies repeatedly fail.
What Does JPMorgan’s New Gold Price Target Actually Mean?
JPMorgan now expects gold to average about $4,300/oz through Q3 2026 and to reach $4,500/oz in Q4, describing the near-term setup as range-bound. That places the bank at the cautious end of Wall Street’s forecasts. Several rivals still project materially higher prices for late-2026 and the next 12 months, leaving a wide institutional spread in outlooks.
Gold price targets — Q4 2026 / next 12 months
Per-ounce forecasts as of July 2026. JPMorgan cut 25% on July 3; other institutions have largely retained higher targets.
Other major banks
Summary of institutional targets (selected): JPMorgan $4,500 · Goldman Sachs $4,900 · Bank of America $4,800 · Deutsche Bank $4,800 · Morgan Stanley upside $5,200 (base ~ $4,400) · UBS $5,200 (12 months).
* Morgan Stanley figure is an upside scenario; UBS figure is a 12-month target. Sources include Reuters, TheStreet and Yahoo Finance (July 2026 reporting).
Those estimates place JPMorgan at the more bearish end of the spectrum. Goldman Sachs projects $4,900 by Q4 2026; Bank of America and Deutsche Bank both call for $4,800; Morgan Stanley’s upside scenario reaches $5,200 for H2 with a base near $4,400; and UBS projects $5,200 over 12 months. The spread between JPMorgan and the most bullish forecasts is roughly $700/oz, reflecting meaningful disagreement about the near-term path of interest rates and ETF flows.
How Wide Is the Wall Street Disagreement?
A roughly $700-per-ounce spread among large institutions is unusually wide and worth noting before relying on any single forecast. The divergence largely reflects different assumptions about near-term rate moves and the size and timing of ETF and private investor flows. Those inputs can move quickly with economic releases and central bank communication.
To put current prices in context: gold traded near $4,007–$4,043 on July 20–21, 2026, below JPMorgan’s Q3 average projection. The metal peaked intraday at $5,589.38 on January 28, 2026 and subsequently corrected by about 28% from that high.
Could Gold Really Fall to $3,500?
JPMorgan describes a downside pathway to $3,500–$3,600 as a tail risk rather than the base case. For that scenario to unfold, two conditions must coincide: (1) surprisingly strong summer economic data that materially raises the odds of earlier Fed hikes, and (2) a Fed that actually moves sooner than markets expect. In JPMorgan’s own base view, the Fed holds through 2026 and delays the first hike until Q3 2027.
If growth surprises push market-implied policy tighter and real yields rise meaningfully, gold could breach technical supports below $4,000, triggering stop-losses and momentum selling that pushes prices toward the $3,500 range. But JPMorgan treats that outcome as a conditional tail risk, not the central forecast.
What Is JPMorgan’s Long-Term Gold Outlook?
JPMorgan retains a long-term bullish case for gold. The bank expects a renewed upward cycle in 2027, driven by structural forces: geopolitical fragmentation, central bank reserve diversification away from fiat currencies, and the eventual normalization of real interest rates. Importantly, the same sensitivity that reduces gold by about $20/oz per basis point of rising real yields works in reverse: declining real yields would add to gold’s price. JPMorgan’s near-term cut is therefore presented as a cyclical adjustment that could create a lower entry point ahead of the next structural leg higher.
The bank’s revision does not alter the deeper drivers that pushed gold from below $2,000 in 2023 to above $5,500 in early 2026. Central bank accumulation, rising sovereign debt burdens and shifting reserve preferences remain intact in JPMorgan’s research.
How Does JPMorgan’s Silver Forecast Change?
JPMorgan now expects silver to average between $60 and $65 per ounce as the market normalizes from 2025’s tight supply conditions. At mid-July 2026 spot levels near $56–$57/oz, that range implies a modest recovery but remains below the early-2026 highs. The bank’s view reflects easing supply stress and an expected normalization of the gold-to-silver ratio rather than a structural collapse in silver demand.
Silver’s demand profile is highly industrial — roughly 58% of consumption — and technologies like solar manufacturing have been reducing silver intensity per panel, which moderates growth in industrial demand. Even so, silver ran persistent deficits through 2025, and JPMorgan’s forecast envisions a market stabilizing after that period of exceptional tightness.
What Are JPMorgan’s Platinum and Palladium Forecasts?
Across the broader precious-metals complex, JPMorgan expects platinum to average around $1,800/oz by year-end 2026 and to rise toward $1,950/oz by end-2027, supported by South African supply fundamentals. For palladium, the bank forecasts roughly $1,350/oz by year-end 2026 and expects it to average about $1,300/oz in 2027, reflecting relative weakness across the complex. The bank’s theme is consistent: a near-term rate-driven cap followed by structural recovery when real yields normalize.
What Does This Mean for Long-Term Precious Metals Holders?
JPMorgan’s revision is a tactical adjustment to a clearly defined mechanism — real yield sensitivity — and does not represent a change in the bank’s structural view for gold and other precious metals. Long-term investors should focus less on a single quarterly target and more on whether the underlying structural forces—geopolitical fragmentation, reserve diversification and the erosion of confidence in fiat reserves among some central banks—are materially different. JPMorgan’s research indicates they are not. The current disagreement among major banks mostly reflects uncertainty about the near-term path of interest rates; when that uncertainty resolves, debate will shift from whether gold belongs in a portfolio to how high it could go.
Stay On Top of Gold & Silver Prices
Get important market alerts sent straight to your inbox.
People Also Ask
Why did JPMorgan cut its gold price forecast for 2026?
JPMorgan reduced its Q4 2026 gold forecast from roughly $6,000 to $4,500, citing softer demand from ETFs, bars/coins and slightly lower central bank buying, combined with a renewed sensitivity of gold prices to rising real interest rates. The bank measured gold falling about $20/oz for each 1 basis point rise in the 10-year real yield since late February 2026. The revision followed a hawkish Fed meeting in mid-June that pushed real yields higher.
What is JPMorgan’s current gold price target for Q3 and Q4 2026?
JPMorgan projects gold averaging $4,300/oz through Q3 2026 and rising to $4,500/oz in Q4 2026, a roughly 25% cut from its earlier target issued in June.
Could gold fall to $3,500 per ounce?
JPMorgan lists $3,500–$3,600/oz as a conditional tail risk that would require stronger-than-expected summer economic data and an earlier Fed rate hike. The bank treats this as a low-probability scenario rather than its base case.
Does JPMorgan still have a long-term bullish view on gold?
Yes. JPMorgan maintains a long-term bullish structural outlook and expects a renewed upcycle in 2027 driven by geopolitical fragmentation, central bank reserve diversification, and eventual normalization of real yields. The near-term downgrade reflects cyclical rate sensitivity, not a change in the structural case.
How does JPMorgan’s gold forecast compare to other major banks?
JPMorgan’s $4,500 Q4 2026 target is the most conservative among major banks. Goldman Sachs ($4,900), Bank of America and Deutsche Bank ($4,800 each), Morgan Stanley (upside $5,200; base ≈ $4,400) and UBS ($5,200 over 12 months) all project higher values, creating a spread of roughly $700/oz across institutional forecasts.
SOURCES
Selected reporting from Reuters, TheStreet and Yahoo Finance in July 2026; public JPMorgan research summaries and industry reports such as the Silver Institute World Silver Survey 2026 and BloombergNEF’s industry notes are the primary source material for figures and market context cited in this piece.
Disclaimer: This article is informational only and does not constitute financial or investment advice. Consult a qualified financial adviser before making investment decisions.
You May Also Like:
- Why HSBC Still Believes Gold Hits $4,750 by Year-End (And What the Mainstream Is Missing)
- State Street Predicts $5,500 Gold by Q1 2027: Is the Dip Over?
- Why China’s Gold Buying Spree Outweighs India’s Pause
- What Is Purchasing Power — and Why Every Dollar You Save Is Slowly Being Taxed Away
- Why Hong Kong? Inside GoldSilver’s Offshore Gold Storage Network
- Silver Price Outlook July 2026: Two Catalysts, One Setup
- Why the 10-5-3 Rule Fails Gold and Silver Investors