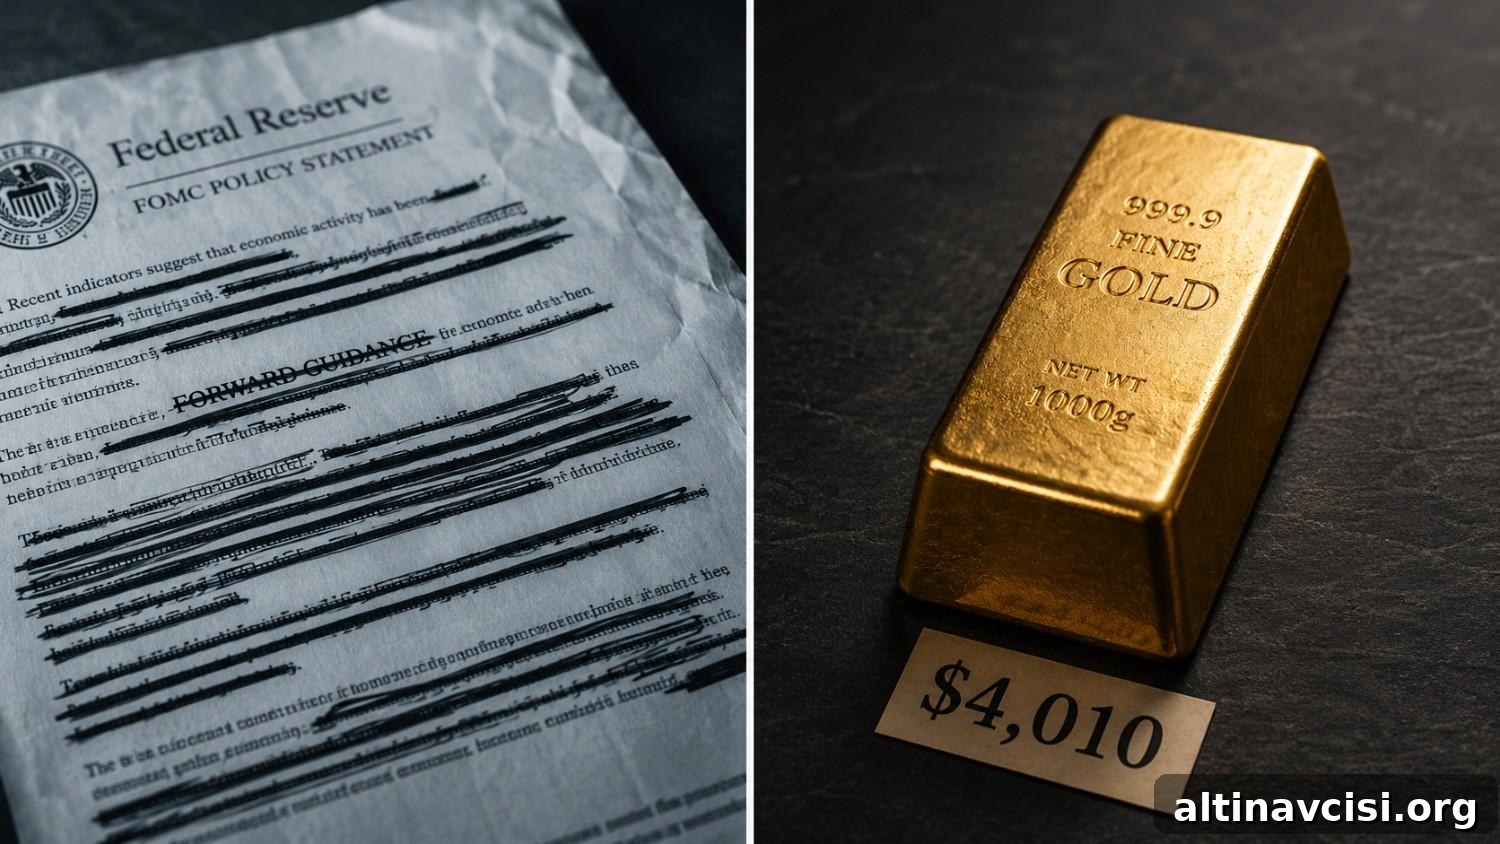
Fed Chair Kevin Warsh appeared before the Senate Banking Committee on Wednesday and delivered a clear message to Wall Street about gold prices and Fed policy for 2026: stop focusing on the Fed and start focusing on the data.
“My message to them is: play the ball, don’t play the Fed,” Warsh said, explaining why he withheld his own rate projection from the June dot plot. “Figure out what’s happening in the real economy, respond to data that’s happening in the real economy, rather than somehow suggest that we’re going to be focused on Wall Street.”
Gold investors heard that and thought: we already do that.
What Does “Play the Ball” Mean for Gold Prices?
Warsh’s instruction is simple in principle: trade incoming economic data instead of relying on central bank forward guidance. But it breaks with more than a decade of Fed communication under Bernanke, Yellen, and Powell. For many years the dot plot, press conferences, and carefully worded statements acted like a second market—guiding traders often more than the economic figures themselves.
The dot plot began in January 2012, and the system built around it has shaped market expectations ever since. Warsh’s recent policy statement was unusually concise; he left out his personal dot plot and signaled that this change is intentional and lasting. That forces markets to do what long-time gold holders have always done: read the economic data directly.
The Edge Every Investor Needs
Smarter precious metals investing starts here. The Nuggets Newsletter brings you essential market insights, Fed updates, global trends, educational videos, and much more.
Why Is Gold Down Today — and What Is the Data Saying?
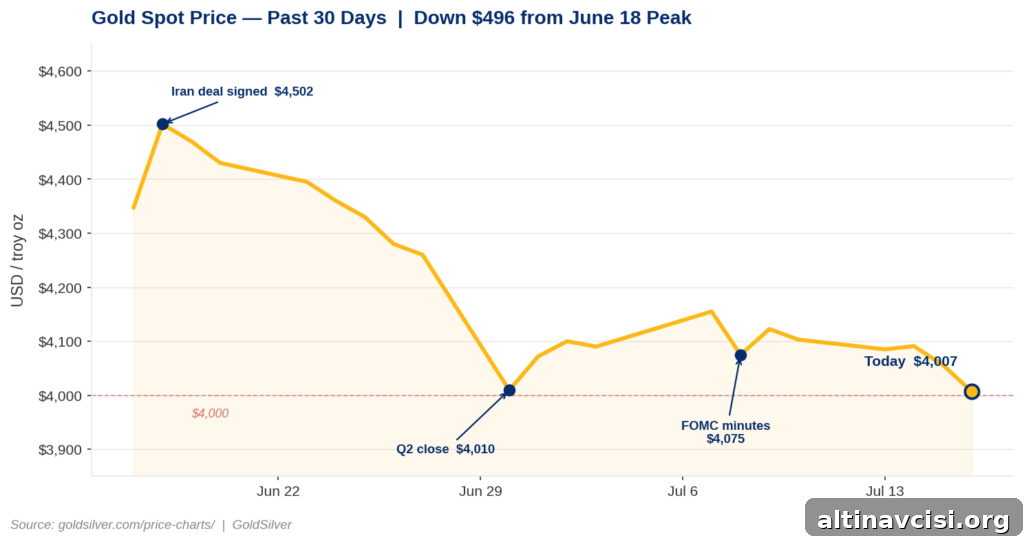
Gold traded near $4,010 as of late morning, down about $50 from the open; silver fell to around $56.38, off roughly 2.4% on the session. Both metals are reacting to concrete economic and geopolitical developments rather than to Fed rhetoric.
First, June CPI showed a 0.4% month-over-month decline—the largest single-month drop since April 2020—and a 3.5% year-over-year rate, softer than consensus. That initially supported metals, but the CPI data predates the recent re-escalation in the Strait of Hormuz and subsequent moves in oil prices.
Second, June retail sales rose 0.2% on the headline measure. Gasoline station receipts fell 5.3% as pump prices eased, while retail sales excluding gasoline rose a healthy 0.7%. A resilient consumer keeps the chance of a September rate hike alive; market-implied odds continue to reflect a meaningful probability for further tightening later this year.
Third, tensions around the Strait of Hormuz have intensified. U.S.-Iran exchanges increased, maritime activity in the area has been disrupted, and oil prices climbed more than 9% over five trading days. Rising oil pushes up inflation expectations and can lift real yields, which raises the opportunity cost of holding non-yielding assets like gold.
The transmission works like this: higher oil → higher forward inflation expectations → higher real yields → greater opportunity cost of holding gold → downward pressure on gold prices. That chain is exactly the sort of data Warsh wants markets to prioritize. Right now, that data is a short-term headwind for gold.
What Does This Mean If You Already Own Physical Gold?
Structurally, Warsh’s approach—trade the data, not the Fed—is more favorable to physical metal holders over a multi-year horizon than the era of heavy forward guidance. When markets moved primarily on Fed language, they sometimes ignored underlying fiscal and monetary realities. That dynamic contributed to volatility and to the inflation surprises of 2021–2022.
With the Fed chair stepping back from forward guidance, the economy’s fundamentals become more visible. Those fundamentals include a national debt that has climbed past $39 trillion, annual interest payments that exceed $1 trillion, and a Federal Open Market Committee split of views on future rates. Those are structural facts that don’t disappear because the Fed talks less; in many ways they become clearer to market participants.
In short, removing the Fed’s steady commentary reduces the risk that central-bank signaling will mute or misdirect how markets price gold. Over time, letting fundamentals and real-world data drive valuations is a condition that can support the long-term case for owning physical metal.
What Is the Next Number That Actually Matters?
For those watching gold prices and Fed policy, the FOMC meets July 28–29. Current market pricing places a modest probability on a July hike, but that meeting itself is not the main pivot point.
The more important release is July 30, the June Personal Consumption Expenditures (PCE) report— the Fed’s preferred inflation gauge. If June PCE shows the same easing seen in CPI and PPI, the odds of a September hike will likely fall. Lower odds for additional tightening ease real yields, which in turn reduces the immediate headwind on gold.
Warsh’s directive gives markets a simple framework: watch the economic data. The next number that will likely shape gold’s near-term trajectory is the June PCE on July 30.
Physical metal holders have long prioritized data over rhetoric; now the Fed chair has publicly reinforced that mindset. That is not a warning but rather a reaffirmation of a market mechanism that should make fundamentals more central to price discovery—and that helps place the long-term argument for physical gold on firmer ground.
Stay On Top of Gold & Silver Prices
Get important market alerts sent straight to your inbox.
SOURCES
1. Federal Reserve — Chairman Warsh Semiannual Monetary Policy Testimony, July 14–15, 2026
2. Investing.com — Warsh Tells Wall Street to “Play the Ball,” Senate Banking Committee, July 15, 2026
3. Bureau of Labor Statistics — Consumer Price Index, June 2026, July 14, 2026
4. US Census Bureau — Advance Monthly Retail Trade Survey, June 2026, July 16, 2026
5. Bloomberg — Iran-US Strikes Worsen as Strait of Hormuz Shipping Traffic Dwindles, July 16, 2026
6. CME Group — FedWatch Tool, July 2026 Rate Probabilities
7. CNBC — Fed Interest Rate Decision June 2026: Dot Plot and SEP Details, June 17, 2026
Disclaimer: This article is for informational purposes only and does not constitute financial or investment advice. Always consult a qualified financial adviser before making investment decisions.
You May Also Like:
- Gold Falls as Retail Sales Confirm the Fed Has No Reason to Cut
- Silver Dropped 1.4% Today. Gold Didn’t. The Ratio Just Hit 70:1.
- Gold Holds as CPI and PPI Both Miss. Here’s Why.
- Gold Is Flat. Oil Is Up 9%. Here’s Why.
- Gold and Fed Policy: When the System Picks Winners
- Warsh Testified. Gold Jumped $90. The Signal Everybody Missed Was in His Report.