
June’s inflation report was released Thursday morning. The Federal Reserve’s preferred inflation measure, the Personal Consumption Expenditures (PCE) price index, declined to 3.7% year-over-year from 4.1% in May and fell 0.1% month-to-month, according to the Bureau of Economic Analysis. That cooler headline number might sound straightforward, but the full report told a more complicated story for markets and for precious metals.
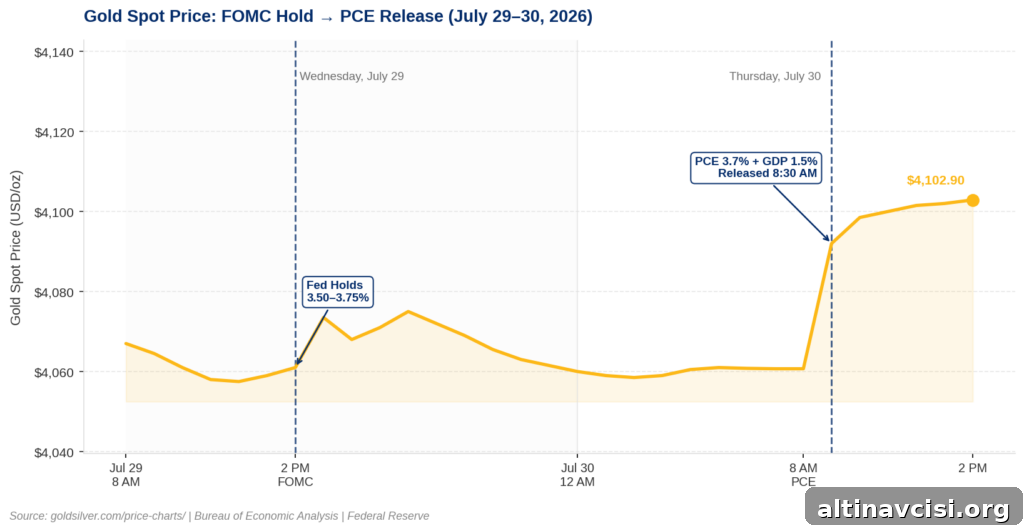
Gold opened higher on the news, trading up roughly $34 at the session’s start. As of Thursday afternoon, spot gold was trading near $4,102.90, an intraday gain of about 0.86% on the day, while silver was stronger, up roughly 1.43% around $58.77. At first glance, weaker inflation might be expected to push gold lower, but focusing only on the headline PCE misses other important dynamics that help explain why gold rose instead.
Why Did the PCE Drop Not Push Gold Lower?
The Bureau of Economic Analysis release contained multiple measures that pointed in different directions. The headline PCE decline was real but narrow in scope: much of the downward pressure came from energy prices, which softened in June amid a temporary lull in Middle East tensions. However, when you strip out volatile food and energy components, core PCE held steady. Core PCE rose 0.1% month-over-month and remained at 3.3% year-over-year, marking several consecutive months at or above that level. In other words, the decline in the headline number largely reflected temporary factors rather than a broad-based cooldown in consumer price momentum.
At the same time, another BEA measure — the GDP Price Index for the second quarter — printed materially higher than expectations. That index came in at 6.3% for Q2, well above consensus estimates. The GDP Price Index captures price changes across domestically produced goods and services, including manufacturing output, business investment, government production, and exports, while excluding imports. It therefore reveals inflation pressures embedded on the production side of the economy that are not fully captured by the consumer-facing PCE. Put simply: inflation looked cooler at the consumer surface but was accelerating inside the economy’s productive sectors. Those mixed signals help explain why gold moved higher rather than lower after the data release.
Market Takeaway
A single headline inflation print rarely tells the whole story for markets. Look beneath the surface for structural trends.
What Did Warsh Say — and Why Does It Matter for Gold?
Federal Reserve Chair Kevin Warsh addressed the press after the Federal Open Market Committee’s recent meeting and made clear that a single month of modest price declines does not meaningfully alter the Fed’s assessment of inflation history and the path ahead. He emphasized that several years of inflation running above target cannot be reversed in a few weeks or by one favorable reading. That stance matters for markets because it signals that the Fed remains focused on longer-term trends rather than short-term monthly moves.
The FOMC vote reflected some division: the committee held the policy rate steady at the recent meeting, but dissenting members favored an immediate hike. Market-implied probabilities for future rate moves shifted after the data, with traders re-evaluating the odds of a September rate increase. In this environment, Fed communication that downplays the importance of a single PCE print can keep monetary policy expectations relatively restrictive for longer, which supports safe-haven and inflation-hedge flows into gold and silver.
What Does the GDP Price Index Mean for Precious Metals Investors?
The GDP Price Index is important because it measures inflation across goods and services produced within the domestic economy, capturing pressures that can feed back into wages, production costs, and corporate pricing power. A much stronger-than-expected reading on that index suggests inflation is becoming embedded on the supply and production side — a scenario that historically favors real assets like precious metals when growth slows but prices remain elevated. The combination of slower headline growth and persistent or rising underlying inflation is the classic stagflationary setup that has historically benefited gold and, at times, silver.
Investors who focus solely on headline consumer inflation may miss these deeper signals. The recent data showed exactly that divergence: a softer PCE headline accompanied by stronger economy-wide price pressures. That divergence helps explain why gold and silver rose even as the PCE edged down.
What Does This Mean for Your Holdings Going Forward?
Looking ahead, key calendar milestones include the next FOMC meeting in mid-September and speaking events such as the late-August policy forum. The recent data has already altered near-term rate expectations: the weaker GDP growth reading reduced immediate hike odds, but stronger internal inflation measures like the GDP Price Index kept longer-run inflation risks visible. Markets are therefore balancing competing narratives, and that uncertainty often supports allocations to gold and silver as hedges.
For holders of physical precious metals, the structural case rests less on any single monthly report and more on broader themes: a central bank constrained by political and economic considerations, inflation that is not fully captured by a single consumer index, and the gradual erosion of purchasing power over time. Silver’s stronger performance versus gold in this session, narrowing the gold-silver ratio, reflects market positioning and sensitivity to shifts between risk-off and inflation-hedge demand. In short, June’s PCE decline did not negate underlying price pressures, and the market’s reaction reflected that nuance.
SOURCES
1. Bureau of Economic Analysis — GDP (Advance Estimate), 2nd Quarter 2026
2. Bureau of Economic Analysis — Personal Income and Outlays, June 2026
3. Federal Reserve — Chairman Warsh’s Press Conference Opening Statement, July 29, 2026
4. Reporting from major financial news outlets on Fed commentary and market reaction, July 29–30, 2026
5. Market spot prices and live quotes for gold and silver, July 30, 2026
Disclaimer: This article is informational only and does not constitute financial or investment advice. Consult a qualified financial professional before making investment decisions.
You May Also Like:
- Gold at $4,100. Silver Still Stuck Below $60. Five Signals Define the Next Six Weeks.
- Oil Spiked 8%. Gold Went Up Anyway. Why This Time Is Different.
- Gold Is Up $40. What the 9–3 Fed Vote Actually Means.
- Iran Tensions and Market Moves: Oil, Gold, and the Price Transmission Chain.
- Everyone Is Watching the Fed. Gold Is Watching the Next Data Release.