Silver Breaks Below $50. Why Is It Falling Faster Than Gold?
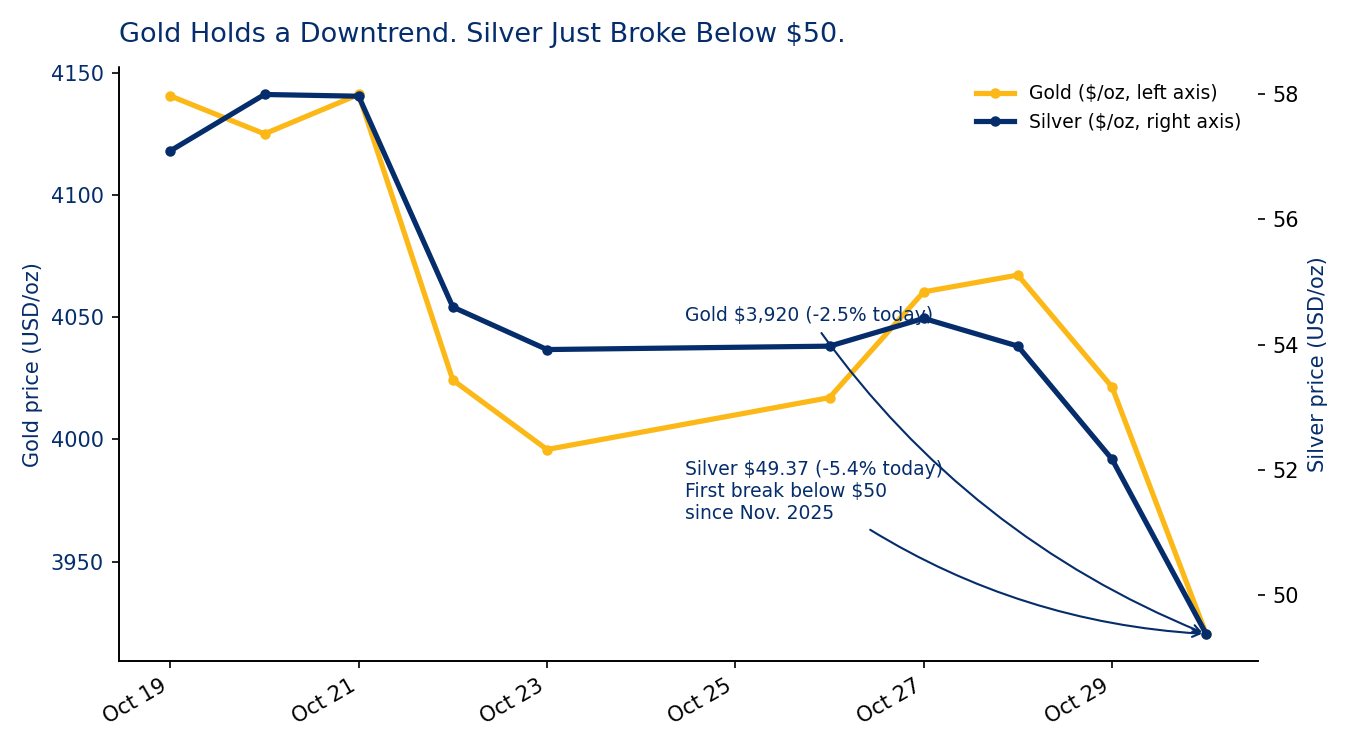
Gold slid to its weakest level since June on Friday. Silver did something it hasn’t done in nearly a year: it broke below $50 an ounce. As of 10:00 a.m. ET, spot gold traded at $3,920.37, down 2.5% on the day, and spot silver traded at $49.37, down 5.4%. That’s silver’s first move under $50 since November 2025, and both metals extended their declines as the session went on.
What Happened to Gold and Silver Prices Today?
Both metals had firmed earlier in the week before Thursday and Friday’s reversal pushed gold to a four-month low and sent silver through a level unbroken since last November. Gold is now down close to 4.7% for October and is on pace for a second straight monthly loss. Silver has fallen harder. It has given back a large share of the gains that took it above $57 earlier this month.
The Edge Every Investor Needs Smarter precious metals investing starts here. The Nuggets Newsletter brings you essential market insights, Fed updates, global trends, educational videos, and much more.
Why Are Gold and Silver Falling Right Now?
The driver is the Federal Reserve’s policy outlook, not a single shock. On Wednesday, the Fed held its benchmark rate at 3.75%-4.00%. However, two policymakers dissented in favor of an immediate hike. Fed Chair Kevin Warsh signaled that inflation remains stubbornly high. Then Thursday’s data gave the hawks more ammunition. The advance Q3 GDP estimate came in at a strong 3.4% annualized, and core PCE inflation held at 2.5% year-over-year. Together, that combination tells traders the Fed has room to raise rates again in December instead of cutting. Higher expected rates lift the opportunity cost of holding gold and silver, since neither metal pays interest. The real-yield data backs that up. The 10-year Treasury’s inflation-protected yield, tracked in the Fed’s own FRED database (series DFII10), climbed to 2.67% by Wednesday, its highest reading in weeks. As a result, both metals have repriced lower in almost a straight line since the GDP release.
Why Is Silver Falling Faster Than Gold?
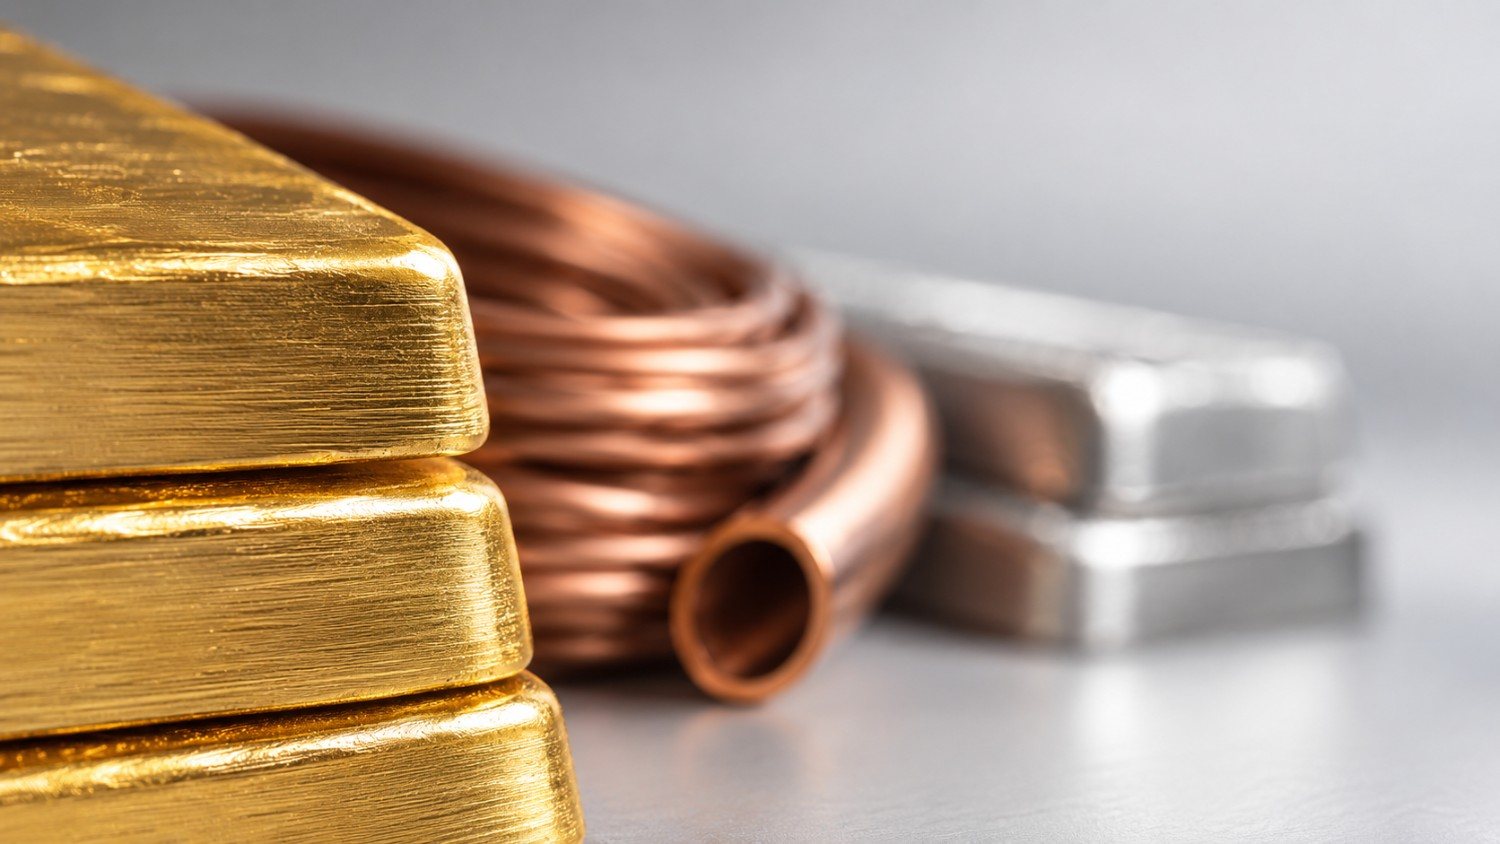
Silver’s bigger drop is not random. Gold trades almost entirely as a monetary and reserve asset. Silver, however, carries real industrial demand from solar panels, electronics and electric vehicles. Per the Silver Institute’s World Silver Survey 2026, industrial use accounted for 657.4 million ounces of demand last year: 58% of the total, and the largest single category. When stronger growth data drives a selloff rather than a safe-haven unwind, investors must reprice silver’s industrial-demand outlook alongside its monetary one. That double exposure is why silver tends to amplify gold’s moves in both directions. It is also why analysts at Metals Focus have flagged further relative weakness in the physical silver market, even as the broader bull case for precious metals stays intact.
What Does the Widening Gold-Silver Ratio Tell Us?
The clearest way to see this split is the gold-silver ratio: how many ounces of silver it takes to buy one ounce of gold. Two weeks ago, on October 19, that ratio sat near 72.5. By Friday it had jumped past 79, a fast move for a ratio that usually shifts gradually. A rising ratio means silver is underperforming gold. That is exactly what has happened since both metals pulled back from their October highs. For long-term owners, a ratio spike like this has historically preceded silver snapping back relative to gold once the rate story settles. Still, nothing about the mechanism guarantees the timing.
Where Does This Leave Gold and Silver Investors?
Friday’s move does not change the multi-year case for owning monetary metals. Central banks have kept buying gold through 2026. The structural pressure on fiat currencies from high debt loads and persistent deficits has not gone away because one GDP report beat expectations. Gold and silver are the measuring stick for that debasement, not a speculative bet on a Fed meeting. What has changed is the near-term path. Gold has already broken through the $3,975 and $3,946 levels traders watched earlier Friday; $3,900 is the next widely cited support. Silver’s intraday low so far today is $49.94, with resistance near $52.24. Rate expectations can move fast, and a data-dependent Fed could turn dovish just as easily on a weaker jobs report. For now, the market’s message is simple: December hike odds got a real boost this week, and both metals, silver especially, are wearing it.
Track live gold and silver spot prices to see how the move develops through the rest of today’s session. For how this fits the monthly setup, read Altinavcisi’s broader October silver price outlook. And for the mirror image of today’s move, revisit how gold defended $4,000 two sessions ago.
Stay On Top of Gold & Silver Prices
Get important market alerts sent straight to your inbox.
SOURCES
1. Quartz — Gold Slips to a 4-Month Low as Inflation Raises Fears of a Fed Interest Rate Hike
2. XTB Market Analysis — Fed Holds, EUR/USD Gains
3. IANS — Gold, Silver Decline Up to 2 pc on Hawkish Fed Signals Ahead of Festive Buying
4. Economies.com — Gold Falls Below $4,000 as Silver Extends Losses Amid Fed Rate Hike Concerns
5. CME Group — Gold Futures Settlement Prices
6. LBMA — Precious Metal Prices
7. U.S. Bureau of Economic Analysis — Gross Domestic Product, Third Quarter 2026 (Advance Estimate)
8. Silver Institute — World Silver Survey 2026
9. FRED — 10-Year Treasury Inflation-Indexed Security, Constant Maturity (DFII10)
Disclaimer: This article is for informational purposes only and does not constitute investment advice. Past performance is not indicative of future results. Always consult a qualified financial advisor before making investment decisions.