Key Takeaways
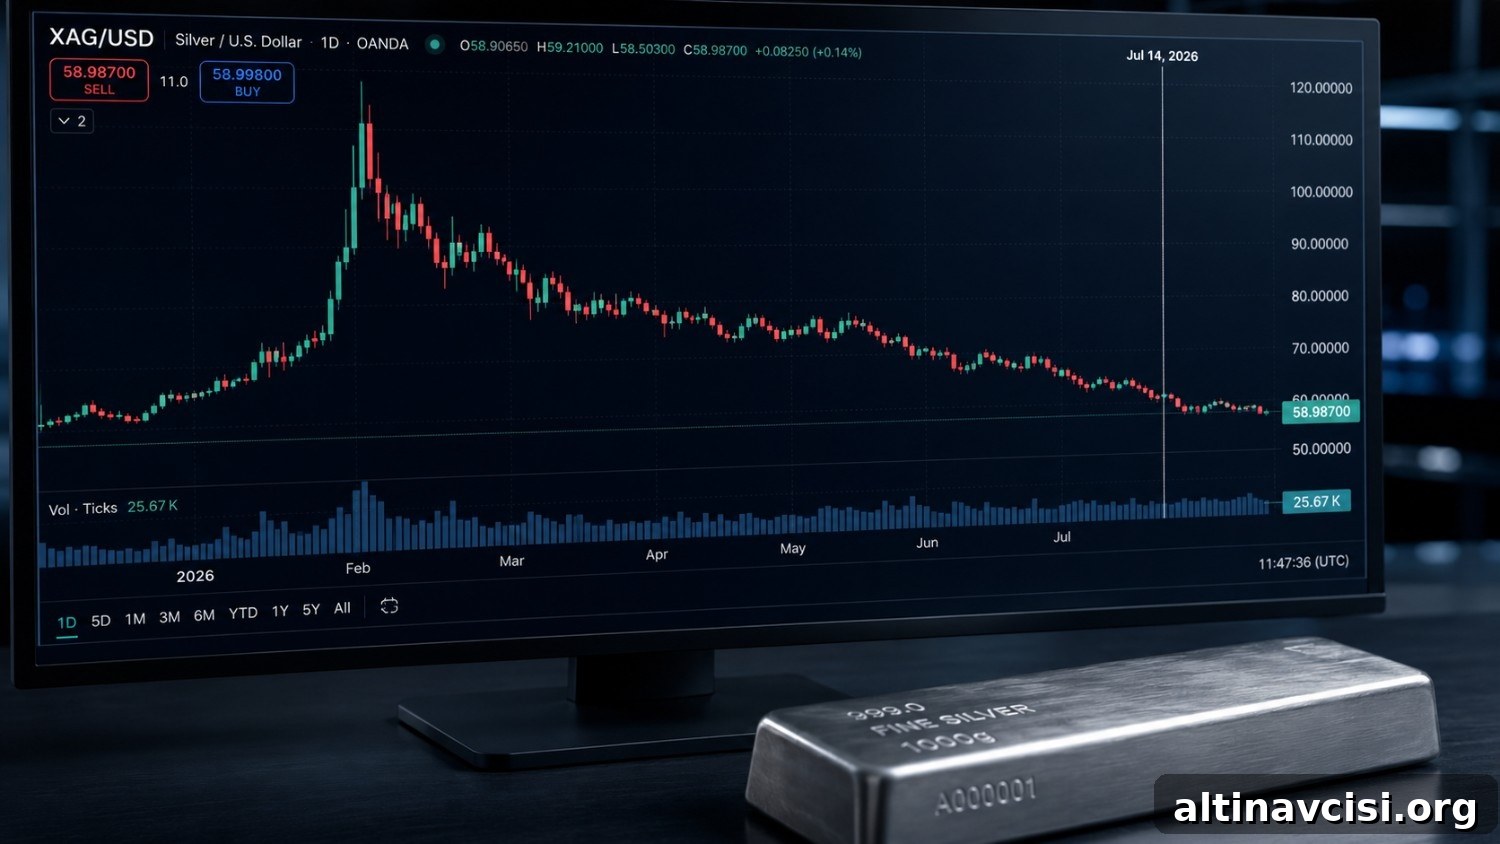
- Silver trades at $58.55 as of July 14, 2026 — roughly 52% below its January all-time high of $121.62.
- The gold-silver ratio sits near 69.2:1, close to the upper end of its 50-year range, indicating silver is undervalued relative to gold.
- June CPI slowed to 3.5% year-over-year — a notable drop from May’s 4.2% and the first monthly decline since April 2020. This is a silver-positive data point.
- The FOMC meets July 28–29. A decision to hold rates would ease upward pressure on real yields and help silver; a hike would push yields higher and weigh on silver.
- The structural supply-demand picture remains intact: six consecutive annual deficits, a 46.3 million ounce shortfall in 2026, and industrial demand representing about 58% of consumption.
- Analyst consensus for 2026 remains well above spot prices: LBMA’s average is $79.57/oz and JPMorgan’s base case is $81/oz.
The silver price outlook for July 2026 opens at $58.55 per ounce, approximately 52% below the record high of $121.62 set in January. Rather than dwell on the prior peak, the relevant question is how two near-term macro events — the June CPI release and the July FOMC meeting — will determine silver’s next moves.
Silver Spot Price — Last 30 Days
USD per troy ounce | Jun 15 – Jul 14, 2026
Source: goldsilver.com/price-charts | Highlighted dates include: Jun 17 FOMC decision, Jul 8 FOMC minutes, Jul 14 June CPI release.
Why Is Silver Down So Much From Its January High?
Three clear, traceable forces explain the decline from $121.62 to the mid-$50s. First, the Federal Reserve’s June meeting left the policy rate at 3.50–3.75% and revealed a divided committee. Some officials signaled further hikes while others favored steady policy, which translated into higher real Treasury yields. Higher real yields increase the opportunity cost of holding non-yielding metals like silver.
Second, May’s unexpectedly hot CPI reading — driven in part by energy supply disruptions — reinforced a hawkish Fed outlook at the time, further elevating real yields and pressuring silver. Third, unlike gold, silver has a large industrial component to demand (roughly 58%). A tighter monetary stance that slows growth directly reduces industrial activity and thus silver demand, leaving gold relatively insulated.
These factors pushed the gold-silver ratio higher, expanding from near 55:1 in May to about 69:1. Importantly, these macro-driven price moves did not alter the fundamental supply-demand balance for silver — only the market price shifted.
The Knowledge That Changes Everything
Two concise guides — free. Learn why gold matters and why fiat systems eventually face stress.
What Does June CPI Mean for the Silver Price Right Now?
The June CPI release on July 14, 2026 showed a meaningful slowdown: headline CPI fell 0.4% month-over-month and decelerated to 3.5% year-over-year from 4.2% in May. Core CPI also eased. Lower inflation reduces pressure for further Fed rate hikes, which tends to lower real yields. That chain — lower inflation → lower rate-hike odds → eased real yields — reduces the carry cost of holding non-yielding silver and supports higher silver prices.
Markets reacted immediately: silver rallied on the print, briefly touching about $59 before settling near $58.55. While a single monthly print does not settle the outlook, June’s inflation data is the most significant near-term datapoint ahead of the July FOMC meeting and it points in silver’s favor.
What Does the July 28–29 FOMC Meeting Mean for Silver?
The Fed’s July decision on July 29 matters for silver because it will influence expectations for policy later in the year. This particular meeting does not include a new dot plot or Summary of Economic Projections, so market participants will focus on Chair Warsh’s press-conference remarks for signals about September. With June CPI softer, the odds of a rate hold have increased. A hold would relieve pressure on real yields and be supportive for silver; a surprise hike would extend upward real-yield pressure and likely weigh on silver.
Broader fiscal constraints are also relevant. Large government debt and rising interest costs limit how far tightening can proceed without substantial fiscal consequences. That constraint is an important backdrop when assessing the Fed’s flexibility and the likely path of real yields.
Is the Silver Supply Deficit Still Relevant in July 2026?
Yes. The structural deficit has not disappeared. The World Silver Survey 2026 reported a sixth consecutive annual deficit of about 46.3 million ounces, wider than 2025’s gap. Since 2021, cumulative withdrawals from above-ground stocks have been substantial. Mine production remains largely flat because most silver is produced as a byproduct of base-metal mining — a supply source that is driven by copper, lead, and zinc economics rather than silver prices alone. In short, higher silver prices have not yet produced a meaningful supply response.
At the same time, industrial demand — roughly 58% of consumption — provides a structural floor for silver. Growing applications in solar PV, electric vehicles, semiconductors, and data centers mean steady, rising demand that does not quickly ebb when prices dip. That persistent structural gap underpins the longer-term bullish case.
What Does the Gold-Silver Ratio Signal in July 2026?
The gold-silver ratio is near 69:1, which means it takes approximately 69 ounces of silver to purchase one ounce of gold. This level sits near the high end of the modern 50-year range. Historically, elevated ratios like this have often preceded periods of silver catching up to gold — that is, silver outperformance. For context, the ratio was near 55:1 as recently as May 2026 before Fed-driven repricing widened it again.
Using today’s gold price as a reference, bringing the ratio down to 65:1 would imply silver near the low $60s, while a move to 55:1 would imply silver in the low-to-mid $70s. The ratio is a valuation indicator rather than a strict forecast, but at current levels it argues that silver is historically cheap relative to gold.
Where Do Analysts See the Silver Price Heading?
Surveys and bank forecasts remain well above current spot levels. The LBMA’s 2026 forecast survey averaged about $79.57 per ounce. Major institutions produced similar mid-to-high range outlooks: JPMorgan’s base case was near $81, HSBC’s forecast clustered around $75, and some firms identified upside above $85 if industrial demand stays strong. Crucially, most of these projections were made before this year’s price correction, and few large houses have revised their full-year averages below current spot levels. That disconnect highlights how temporary macro factors, rather than fundamentals, have driven the recent price weakness.
Stay On Top of Gold & Silver Prices
Get important market alerts sent straight to your inbox.
People Also Ask
What is the silver price today in July 2026?
As of July 14, 2026, silver traded around $58.55 per ounce. Intraday ranges varied, and prices were up modestly the day the softer June CPI print was released.
What is the gold-silver ratio right now?
On July 14, 2026 the gold-silver ratio was approximately 69.2:1, near the upper bound of its modern 50-year range. Historically, ratios this elevated have often preceded periods where silver outperformed gold.
Is the silver supply deficit still happening in 2026?
Yes. The World Silver Survey 2026 reported a 46.3 million ounce deficit, marking the sixth consecutive annual shortfall and a widening from 2025. Cumulative stock drawdowns since 2021 have been substantial.
What do analysts forecast for the silver price in 2026?
Analyst consensus sits well above current spot: LBMA’s average near $79.57/oz, JPMorgan’s base case around $81/oz, and other large houses generally in the mid-to-high $70s or higher.
How does the July 28–29 FOMC meeting affect silver?
The Fed’s July 29 decision will influence markets through its actual policy decision and the language of the Chair’s press conference. A hold or dovish tone would relieve real-yield pressure and support silver. A surprise hike would raise real yields and likely weigh further on silver. The softer June CPI has already increased the odds of a hold.
SOURCES
1. Federal Reserve — FOMC materials and statements
2. Bureau of Labor Statistics — Consumer Price Index releases for May and June 2026
3. Silver Institute / Metals Focus — World Silver Survey 2026
4. LBMA — 2026 Annual Precious Metals Forecast Survey
5. Major bank research and market-price providers for price and analyst-consensus context
Disclaimer: This article is informational only and does not constitute financial or investment advice. Consult a qualified financial adviser before making investment decisions.
You May Also Like:
- Why the 10-5-3 Rule Fails Gold and Silver Investors
- Why Is Silver So Hard to Mine? The Primary Supply Problem Explained
- Gold Price Outlook July 2026: The Price Fell. Case Intact.
- Buying the Top: A Survival Guide for Gold and Silver Investors
- How Do Gold Price Cycles Work? A Framework Across Four Time Horizons
- The $300 Billion Lesson: What Frozen Reserves Taught Central Banks About Gold
- How To Perform Silver Technical Analysis (in 5 Steps)